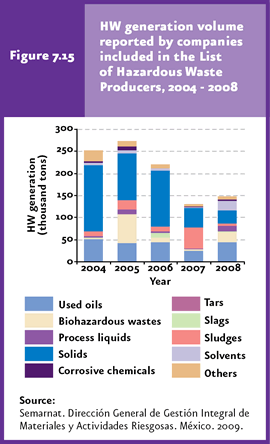
Between 2004 and 2008 a generation of one million 25 thousand 128 tons of hazardous wastes was estimated in Mexico, based on the companies included in the Registry of Producers of Hazardous Waste. |
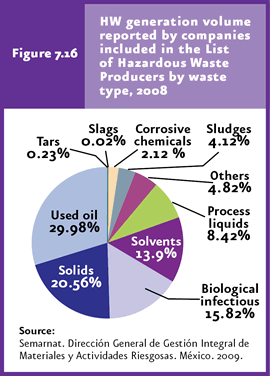
The HW produced in greatest amounts in 2008 included used oil (nearly 30% of total HW generated), followed by solids (20.6%) and biohazardous wastes (15.8%). |
| CHAPTER 7. WASTES |
Progress made by the chemical industry has enabled the development of a large variety of chemicals used as products or raw materials for a number of goods consumed by the world society (Refer to the Box The universe of chemicals). Although it is true that these have significantly improved the living standards of the population, these also impose an important pressure on both the environment and human health. A consequence of the use of chemicals and hazardous materials, both in production processes and household applications, is the generation of hazardous waste (HW). Furthermore, once the useful life of a product has ended, it may become a hazardous waste due to the nature of its components (refer to the Box The issue of batteries). For a waste to be deemed hazardous, it must possess some of the six hazardousness characteristics as defined by CRETIB: corrosiveness (C), reactivity (R), explosiveness (E), toxicity (T), flammability (F) or bio-hazardousness (B).
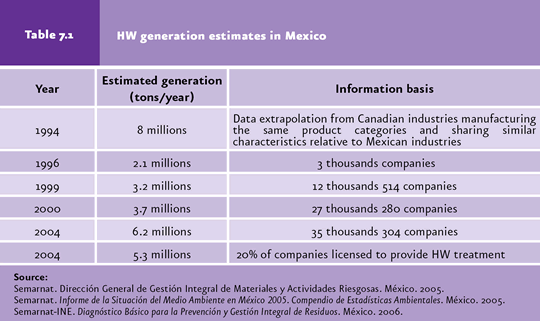
Generation of hazardous wastes The earliest estimates of the volume of hazardous wastes generated in the country were made by the National Institute of Ecology (INE after its initials in Spanish) in 1994. Since then, a number of figures have been reported, based essentially on the information reported by several companies that either produced or treated this type of wastes (Table 7.1).
The most recent estimate on the volume of HW generated during the period 2004-2008 is equivalent to 1 million 25 thousand 128 tons (Semarnat, 2009; Figure 7.15). This is based on the data reported by 27 thousand 465 companies recorded in the Registry of Producers of Hazardous Waste (PGRP after its initials in Spanish) compiled by the Semarnat. This figure, however, should not be regarded as the total volume of hazardous waste produced in the country for that period, due, on one hand, to the fact that the PGRP does not include all the companies that generate hazardous wastes in Mexico; on the other hand, to date information is only available from 27 of the Semarnat’s state delegations3 which are in charge of reviewing and issuing the reports on HW generation in their respective states.
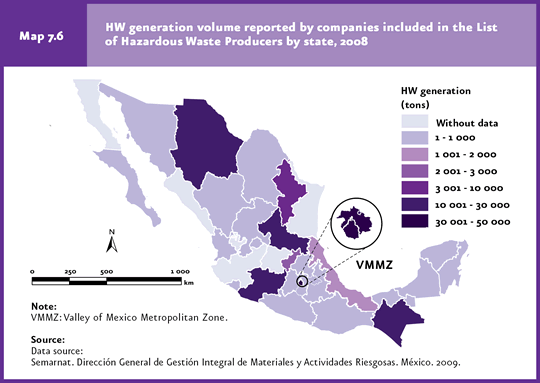
The differences between this latter estimate of HW generation and the former stems mainly from the following: 1) number of companies and delegations used to calculate the volume generated, as explained above; 2) the recent review of the Registry and the revision of the HW generation reports issued by the delegations, which made possible to eliminate duplicated data and errors in the estimates of HW generation by producers; and 3) the modification of NOM-052-SEMARNAT-1993 – currently NOM-052-SEMARNAT-2005 – which sets forth the characteristics of hazardous wastes, and from which mining wastes and drilling wastes from the oil industry were removed, which previously constituted a significant fraction of the total HW generated that had been reported in previous estimates (Semarnat, 2009; see the Box Tailings and drilling wastes). At the regional level, in 2008 the generation of HW concentrated in the Valley of Mexico Metropolitan Zone (with nearly 31% of the total volume generated), followed by Chihuahua, with around 17% (Map 7.6). By contrast, Morelos, Colima and Yucatan jointly produced a mere 0.2% of the total. If generation is analyzed by type of waste, in 2008 the largest fractions corresponded to used oil (nearly 30% of the total generated), followed by solids (including asbestos, industrial-maintenance wastes and heavy metals, among others; 20.6%) as well as biohazardous wastes (15.8%) (Figure 7.16). The less abundant HW produced were tars, slags and corrosive chemicals (2.4%).
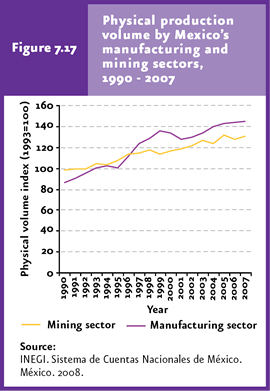
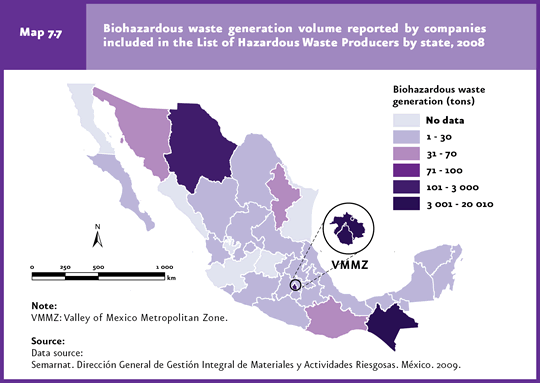
With regard to the generating sourced of hazardous waste, the manufacturing and mining industries are the most important contributors in the country (OCDE, 1998). Although no data on the amount produced are available, the physical volume index4 (which considers the economical value of production) may shed some light on the generation potential. In the manufacturing sector, production rose 45% relative to 1993, while the mining industry increased 30.5% (Figure 7.17; IB 5-1). Of the hazardous wastes generated in the country, biohazardous wastes are particularly important due the health risks they impose. The volume of biohazardous wastes generated in Mexico in 2008 was a little less than 16% of total HW (Figure 7.16), reaching approximately 23 thousand 383 tons, 98% of which were produced in Chiapas and the VMMZ (Map 7.7). With regard to the type of biohazardous waste, 54% of the total generated corresponded to non-anatomical wastes, followed by pathological waste (40%), sharp and cutting instruments (4.8%) blood (0.9%) and microbial cultures and strains (0.3%).
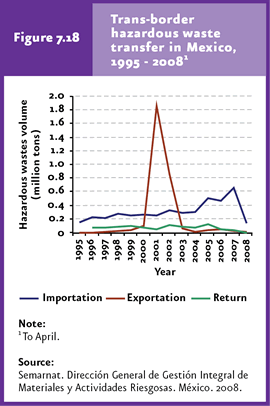
Trans-border transport of hazardous waste Mexico and the US maintain an active flow of hazardous wastes, which essentially takes place through three ways: 1) the Mexican industry that exports their hazardous waste, 2) the Mexican recycling companies that import wastes for their industrial processes, and 3) the return of HW. The latter occurs when products, equipment, machinery or any other input is temporarily imported for remanufacturing, recycling or reprocessing and this produces hazardous wastes which, in turn, have to be sent back to the country of origin. Between 1995 and April 2008, approximately 4 million 355 tons of wastes were imported in Mexico for treatment or use; additionally, 980 thousand 878 tons of raw materials entered the country for temporary use by the contract-manufacturing industry. Exports amounted to 3 million 123 thousand tons of waste for this same period (Figure 7.18; Cuadros D3_RESIDUOP01_02; D3_RESIDUOP01_03 and D3_RESIDUOP01_04). Exports remained lower than imports until the year 2001, when exports increased substantially as a result of the exportation of drilling wastes (that is, soil and rocks removed during oil-well drilling operations) which, up to that date, had been considered as hazardous wastes (see the Box Tailings and drilling wastes).
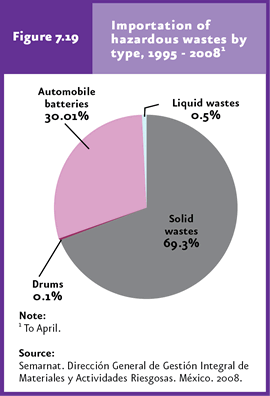
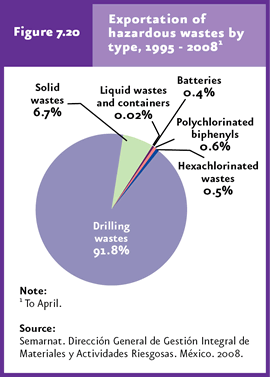
99.3% of the wastes imported between 1995 and April 2008 corresponded to solid wastes and storage batteries (Figure 7.19), whereas oil-drilling wastes contributed with the highest percentage (91.8%) of exports (Figure 7.20).
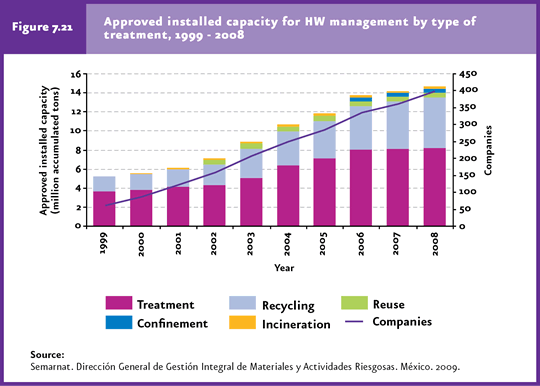
Hazardous waste management The safe management and/or disposal of hazardous wastes may be achieved in a number of ways: a) by minimizing generation; b) by recycling and reusing prior to treatment and final disposal; c) by treating wastes to reduce hazardousness; and d) by suitable confinement. Between 1999 and 2008, 399 companies that handle hazardous wastes were registered, with an approved installed capacity of 14.7 million tons5. The increase in the approved installed capacity mainly involved the capacity for recycling and treatment, which increased from 1.6 to 5.3 million tons and from 3.7 to 8.2 million tons, respectively (Figure 7.21; IB 5-4 and IC 5).
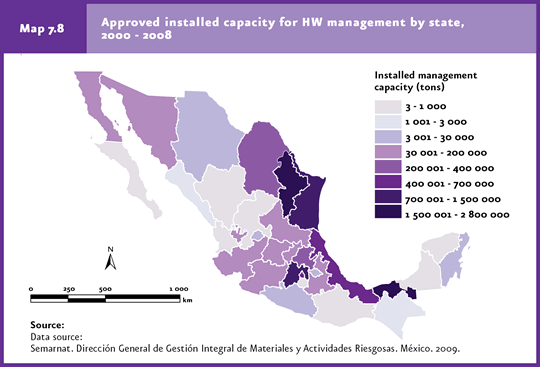
At the state level, 78.2% of the installed capacity approved for HW management in the period 2000-2008 was concentrated in five states: Nuevo Leon (29.2%), Tabasco (17.2%), State of Mexico (13.6%), Tamaulipas (11.2%) and Veracruz (7%; Map 7.8; Cuadros D3_RESIDUOP01_07; D3_RESIDUOP01_10_D; D3_RESIDUOP01_08; D3_RESIDUOP01_15 and D3_RESIDUOP01_09). By contrast, Zacatecas, Yucatan and Nayarit had a management capacity below 7 tons each.
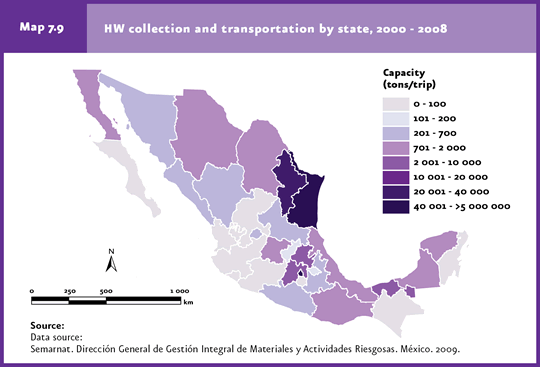
As to the infrastructure for collection and transport of HW, the greatest capacity in the period 2000-2008 was concentrated in the state of Tamaulipas (98.1% of the total). By contrast, Colima was the only state in the country lacking specific infrastructure for collecting and transporting hazardous wastes (Map 7.9; Cuadro D3_RESIDUOP01_17).
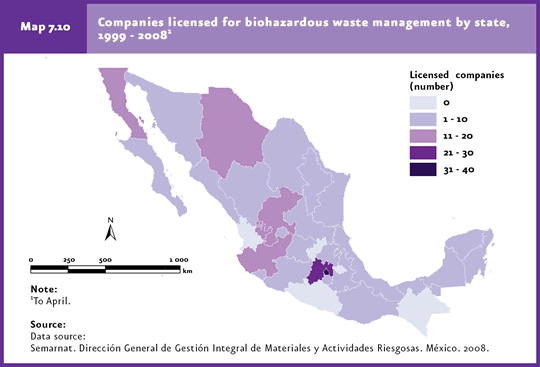
During the period 1999-20086, an installed capacity to manage more than 103 thousand tons of biohazardous wastes was available in most of the country’s states; however, Guerrero, Nayarit, Queretaro, Tlaxcala and Chiapas had no companies dealing with biohazardous wastes (Map 7.10; Cuadros D3_RESIDUOP01_11; D3_RESIDUOP01_18; D3_RESIDUOP01_13 and D3_RESIDUOP01_14).
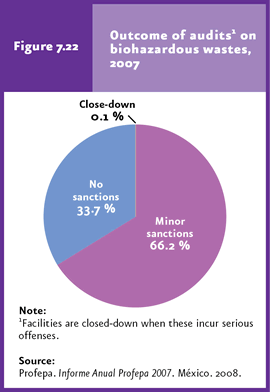
According to the General Law for Waste Prevention and Integrated Management, producers and managers of HW should manage these wastes in a safe and environmentally proper way (DOF, 2003); for this reason, Profepa applies inspection and surveillance programs to oversee that regulations are met (Profepa, 2008). Irregularities are identified through inspection visits, from which corrective measures are set and facilities are closed-down when serious irregularities are found that represent an imminent risk to ecological balance, serious damage to natural resources or contamination with serious consequences for ecosystems or public health. Compliance with corrective measures is overseen through check-up visits. In 2007, 5 thousand 911 inspection visits were made7 to facilities registered as generators of hazardous waste and companies serving these facilities, including 5 thousand 17 companies (Profepa, 2008). The Mexican Official Standard, NOM-087-ECOL-SSA1-2002, for the in-house management, transportation, treatment and final disposal of biohazardous wastes in healthcare facilities came into effect in 2003 (Profepa, 2008). In order to oversee compliance with this standard, 757 audits were conducted, a high percentage of which detected minor irregularities (66.2%) and only one temporary partial close-down of an audited facility was applied as a safety measure (Figure 7.22; Profepa, 2008). Between 2001 and 2007, five thousand 180 audits were conducted, one thousand 612 of which recorded full compliance with regulations (31.1% of the total), 3 thousand 559 (68.7%) resulted in minor sanctions and only in 9 cases (0.2%) facilities were closed down for improper waste management (Profepa, 2008).
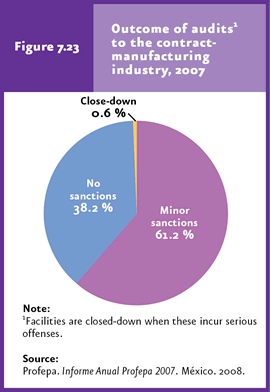
Last, in the contract-manufacturing sector, with a little over 3 thousand 200 companies, 2 thousand 421 of which are audited by Profepa. A total of 348 audits were conducted in these companies during 2007: no irregularities were detected in 133 cases; 213 resulted in minor sanctions, and total temporary close-down was decreed in only 2 cases (Figure 7.13; Profepa, 2008).
Notes:
3As of December 2008, the reports corresponding to the Baja California, Sinaloa, Jalisco, Guanajuato and Tamaulipas delegations were missing. 4The physical production volume is used as a measure of the activity in the sector, which reflects the potential HW generation. 5The actual capacity for hazardous waste management may be lower than the approved installed capacity, given that the management companies cannot work at 100% of the approved capacity. 6Data as of April 2008. 7More than one audit may be conducted in HW-producing facilities.
|
