It is estimated that 36.9 million tons of urban solid wastes were generated in 2007, which is equivalent to 101 thousand tons per day. |
In 2007, 32.3% of the USW generated was potentially recyclable |
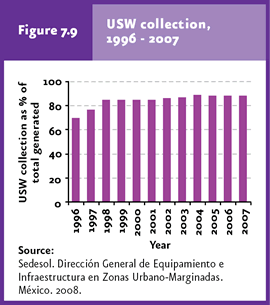
In 1996, 70% of the wastes generated in the country were collected; this increased to 88.4% in 2007. |
67% of the USW generated in 2007 were disposed of in sanitary landfills and controlled sites; the rest was dumped in uncontrolled sites. |
| CHAPTER 7. WASTES |
More formally, the General Law for Waste Prevention and Integrated Management (LGPGIR from its initials in Spanish) defines wastes as those materials or products discarded by the owner and found as solids, semi-solids, liquids or gases and contained in deposits or containers; these may be susceptible of being valued or require to be subjected to treatment or final disposal according to the provisions established in the Law (DOF, 2003). According to their characteristics and origin, wastes are classified into three major groups: urban solid waste (USW), waste requiring special management (RME from its initials in Spanish) and hazardous waste (HW).
URBAN SOLID WASTE1 Urban solid wastes are those generated in households as a result of the disposal of materials used in household activities (for example, consumer products and their packages and containers). These also come from any other activity conducted inside a facility or in public spaces, with household features, and those generated in public areas provided these are not considered as other types of waste (DOF, 2003).
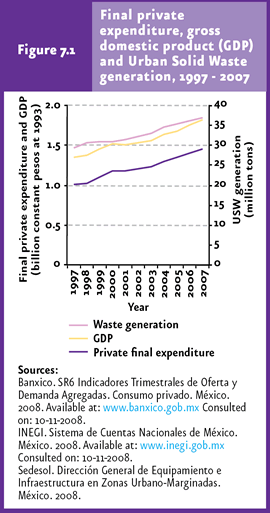
Generation of urban solid waste The current country-wide figures on USW generation have important limitations, basically because these are estimates rather than direct measurements. According to the provisions set forth in the Mexican standard NMX-AA-61-1985 on the Determination of Solid Waste Generation, estimates of the country-wide generation are calculated based on the mean per-capita solid waste generation (as kg/inh/day) from the information obtained through random field sampling over 8 days for each socioeconomic strata of the population. The daily generation and an annual country-wide estimate can be calculated from the estimates of the per-capita generation. In 2007 a generation of 36.9 million tons was estimated, which represents a mean daily production of approximately 101 thousand tons. This figure has increased notoriously over the last years, basically due to urban growth, industrial development, technological change and changes in the consumption patterns of the population. As an example, over the last ten years the total generation of USW increased 26%, in parallel with the Gross Domestic Product (GDP) and the population expenditure2 (Figure 7.1; Cuadro D3_RSM01_02; IB 4-1 and 4-2).
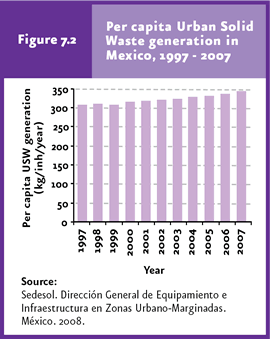
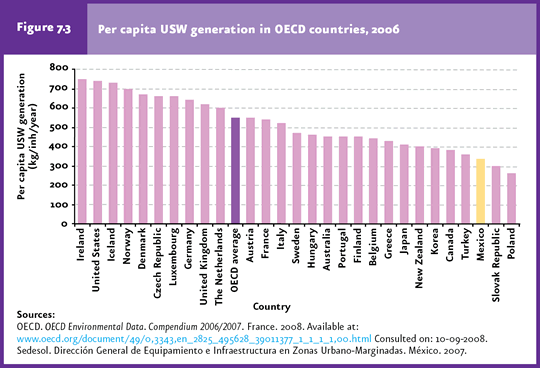
The daily per-capita generation grew from 300 grams in 1950 to nearly one kilogram in 2007. On a yearly basis, the per-capita generation increased some 4 kilograms per year on average between 1997 and 2007, reaching 349 kilograms per inhabitant in 2007 (Figure 7.2; IB 4-2). The national per-capita generation in 2006 (336 kg/inh/year) was 39% lower than the corresponding average for OECD countries (550 kg/inh/year; Figure 7.3). In that year, an average Mexican citizen generated 29% more wastes than a Polish citizen and nearly 45% of the volume generated by an average Irish citizen (OECD, 2008).
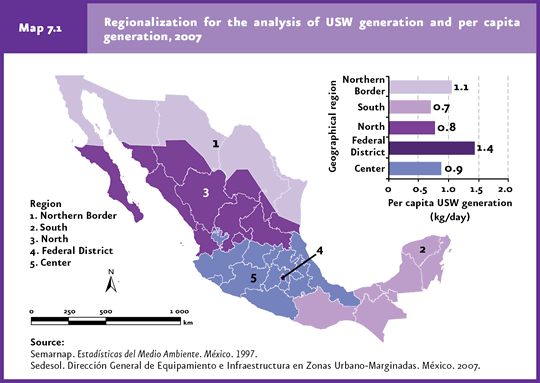
In Mexico, the per-capita generation shows important variations between regions and states, basically stemming from the influence of cultural factors, income levels and migration towards urban centers, among others (Cuadro D3_RSM01_01). When the regionalization established by the Ministry for Social Development (Sedesol) is considered for the analysis of waste generation, in 2007 the Federal District and the Northern Border had the highest per-capita generation of USW, with nearly 1.4 and 1.1 kilograms per day, respectively, whereas the inhabitants of other regions, including the Southern region, generated of less than one kilogram per day on average (Map 7.1).
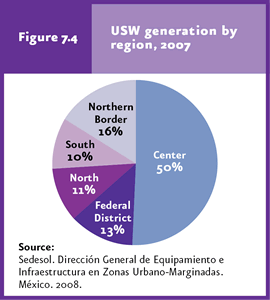
As for the total waste generation, there are also important variations between regions. For instance, the Centre contributes one half of the total generation of USW in the country, followed by the Northern Border (16% of the total) and the Federal District (13%; Figure 7.4; Cuadro D3_RSM01_01). Over the period 1997-2007, waste generation in the Centre, South and Federal District regions rose in 33, 26 and 13%, respectively. The Northern Border and Northern region are outstanding cases, as waste generation in the former nearly tripled (from more than 2 thousand tons in 1997 to nearly 6 thousand in 2007), whereas it decreased in 33% in the latter, over the same period of time.
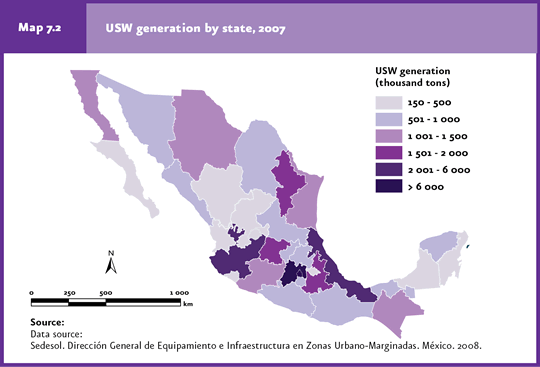
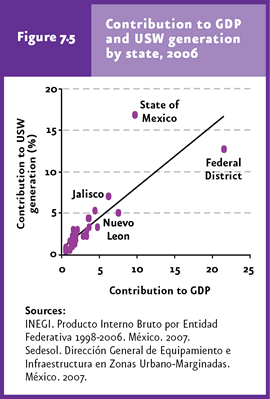
In 2007, the states that generated the largest amounts of waste were the State of Mexico, Federal District and Jalisco, whereas the lowest amounts were recorded in Colima, Baja California Sur, Campeche and Nayarit (Map 7.2; Cuadro D3_RSM01_04). When the relative contribution of the states to the Gross Domestic Product is analyzed, a positive linear relationship with their contribution to the nation-wide generation of USW is evident (Figure 7.5). However, the contribution that states such as the State of Mexico and the Federal District make to the nation-wide generation of USW departs significantly from the overall trend followed by the rest of the states.
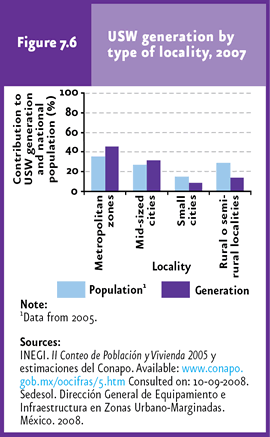
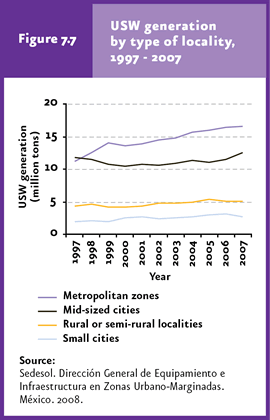
If waste generation is examined in relation to the size of localities, it is evident that localities with populations smaller than 15 thousand inhabitants (the so-called “rural” or “semi-rural” localities, which are home to 37% of the country’s population) only generated 13.6% of the total volume of wastes, whereas metropolitan zones (localities with over one million inhabitants) contributed 44.9% to the country´s total (Figure 7.6). The evolution of waste generation per type of locality between 1997 and 2007 shows that waste generation increased 48% in metropolitan zones, 45% in small cities and 15% in rural or semi-urban localities (Figure 7.7). The volume of waste generated in mid-sized cities remained virtually unchanged over this period of time (Figure 7.7; Cuadro D3_RSM01_02).
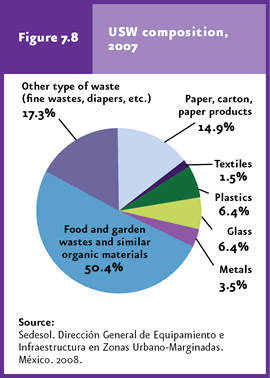
Waste composition has also changed significantly through time at the national level. In general, USW composition depends on the population’s consumption patterns, among other factors. A correlation has been found between the composition of USW generated and the country’s economic status: those with the lowest income generate less waste in which organic residues predominate, in contrast with countries with higher income (BID-OPS, 1997). The case of Mexico illustrates the shift from one type of economy to the other: In the 1950s, the percentage of organic residues in household waste ranged from 65 to 70% of the total volume, while by 2007 this figure dropped to 50% (Figure 7.8; Cuadro D3_RSM01_10). In this latter date, 32.3% of the USW generated were potentially recyclable, particularly paper and carton (14.9%), glass (6.4%), plastic (6%), metal (3.5%) and textiles (1.5%).
Management and final disposition of urban solid waste The ultimate goal of proper USW management is to protect human health, reducing exposure to injuries, accidents, inconveniences and diseases caused by contact with wastes, as well as avoiding the potential impact on ecosystems. For a long time, USW management was not adequate and, even today, modern techniques have still not been fully implemented throughout the country to solve this issue, so that it is relatively frequent that wastes are dumped in land near roads or in natural troughs such as gullies, ravines and watercourses. USW management involves several phases, from waste generation, storage, transport and treatment to final disposition in different sites. Some of them involve important aspects of the waste lifecycle, such as collection, recycling and final disposal, which are detailed below.
Collection In 1996 nearly 70% of the wastes generated in the country were collected, a figure that rose to 88.4% by 2007 (Figure 7.9; Cuadro D3_RSM01_05). However, this figure also changes depending on whether it refers to metropolitan zones, mid-sized cities or small urban areas. In the large metropolitan zones, the coverage of waste collection can be as high as 95%, ranges between 75 and 85% in mid-sized cities and between 60 and 80% in small urban areas (Semarnat-INE, 2006).
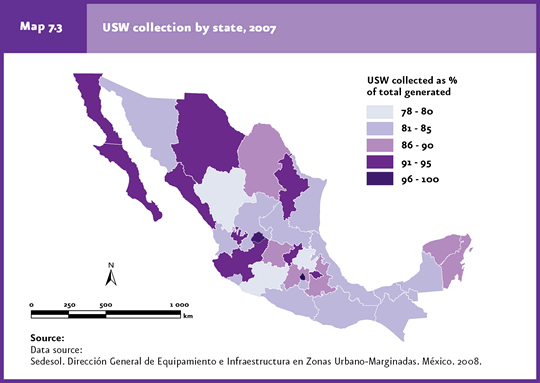
In 2007, the states with the highest coverage of USW collection were the Federal District (98% of the volume generated), Aguascalientes (97.5%), Baja California Sur (94.7%) and Tlaxcala (94.4%), whereas the states with the poorest coverage were Hidalgo (78.1%), Durango (78.6%), Oaxaca (78.9%) and Michoacan (79.9%; Map 7.3; Cuadro D3_RSM01_05).
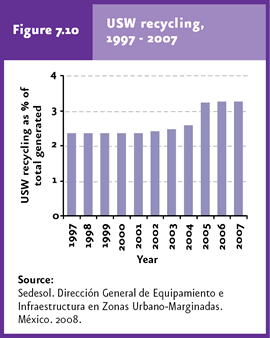
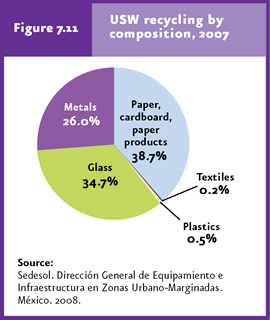
Recycling Although increasing, the volume of USW that is recycled in the country is still low. According to figures obtained from landfills, 3.3% of the generated volume of RSW in 2007 was recycled (Figure 7.10; Cuadro D3_RSM01_10; IB 4-5). However, this figure might be higher and even reach 10%, as much of USW that is potentially recyclable is recovered directly from waste bins and collection trucks. Of the total volume of USW recycled in 2007, the highest percentage corresponded to paper, carton and derivatives (38.7%), followed by glass (34.7%) and metals (26%; Figure 7.11; Cuadro D3_RSM01_10). On the other hand, if the volume recycled of each type of USW is analyzed in relation to the volume produced, the solids with the highest recycling rate in 2007 were metals (24.1% of the total amount of metals generated), glass (17.8%), paper (8.5%) and plastics and textiles, with 0.3% each.
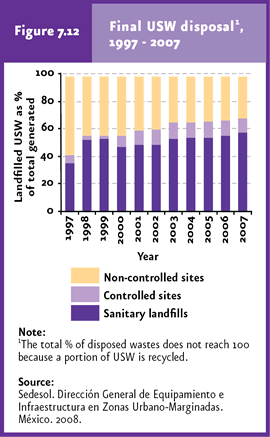
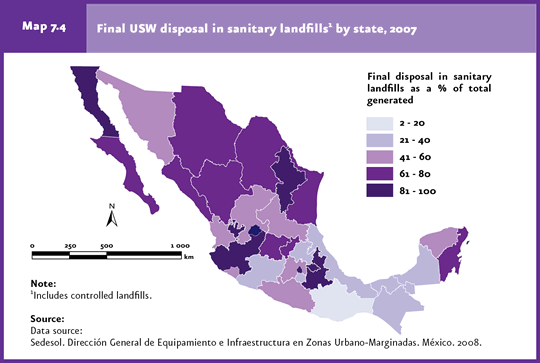
Final disposal Final waste disposal refers to its permanent placement or confinement in sites or facilities the characteristics of which prevent the release of wastes to the environment and the potential affectation to human and ecosystem health. Final waste disposal sites (both sanitary and controlled landfills) must: 1) warrant the extraction, capture, transportation and control of biogases generated; 2) warrant the collection and extraction of leachates; 3) have pluvial drainage to deviate runoff and dislodge rainwater; 4) control the scatter of lightweight materials, as well as noxious fauna and pluvial infiltration. Sanitary landfills constitute the best solution for the final disposal of USW and of those requiring special management. This type of infrastructure involves specific engineering methods and operations to control, through the treatment of leachates (that is, fluids that drain off directly from wastes or by the effect of rainfall), the flaring of gases, reforestation of the landfill site and odor control, the potential impact of wastes on public health and the environment. It was estimated that 67% of the volume of USW generated in the country in 2007 was disposed of in sanitary landfills and controlled sites, and the rest was dumped in uncontrolled sites. This represents an important increase if it is considered that in 1997 nearly 60% of wastes were dumped in uncontrolled sites (Figure 7.12; Cuadro D3_RSM01_09_D; IB 4-3). At the state level, in 2007 the Federal District, Aguascalientes and Nuevo Leon disposed of virtually all their wastes in sanitary landfills and controlled sites. However, in Oaxaca, Hidalgo and Chiapas only a low volume of USW were disposed of in these type of facilities: less than 30% of the total wastes generated (Map 7.4; Cuadro D3_RSM01_09_D).
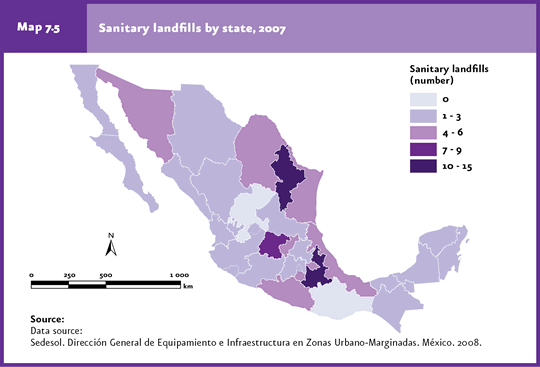
With regard to the number of landfills existing in Mexico, significant progress has been achieved in establishing this type of infrastructure over the last years. Between 1995 and 2007 the number of landfills increased from 30 to 114, having an additional 24 controlled sites in 2007. Only Oaxaca and Zacatecas lacked sanitary landfills in 2007; these states, however, had one and three controlled sites, respectively (Map 7.5; Cuadro D3_RSM01_07_D).
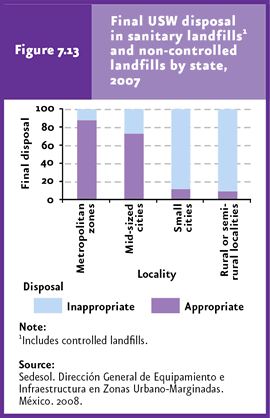
In general, advances in sanitary landfills in Latin America have mostly focused on large cities (BID-OPS, 1997), and Mexico is no exception. When the proper disposal of waste is analyzed by type of locality, in metropolitan areas 88% of wastes are properly disposed of, that is, in sanitary landfills and controlled sites; whereas in rural or semi-urban localities this figure is a mere 9.6% (Figure 7.13; Cuadro D3_RSM01_08_D).
Note: 1Note: With the publication of the General Law for Waste Prevention and Integrated Management (DOF, 2003), the denomination of municipal solid wastes changed to urban solid wastes (USW). In this chapter, these wastes will be referred to using the latter name, including those mentioned before 1997, generated based on the Mexican Standard NMX-AA-61-1985, that sets forth the method for determining municipal solid waste generation (DOF, 1985).
|
