In Mexico, the coverage of potable water reached 89.9% in 2007. |
| CHAPTER 6. WATER |
Services and environmental protection Population wellbeing depends, to a great extent, on access to basic services, being potable water and sewage systems two of the most important services. These not only meet the drinking needs and other household uses such as hygiene, but are also closely linked to population health. Today, it is acknowledged that polluted water is responsible for about 80% of diseases in developing countries, the death of 2.2 million persons per year (50% of which are children under 5 years old), and 400 million cases of malaria (cited in Carabias and Landa, 2005). Clearly, a priority for the world´s governments has been promoting the building of hydraulic infrastructure to take potable water and sewage services to the ever growing population. However, there is still much to be done. Even though the latest report on the Millennium Development Goals points out that since 1990 to date one thousand 600 million persons throughout the world have gained access to potable water, it also acknowledges that 2 thousand 500 million persons lack improved sanitation services (UN, 2008). Therefore, the challenge to reach full coverage of potable water and sanitation services in urban and rural areas still remains as one of the greatest challenges to be met for many countries, Mexico included.
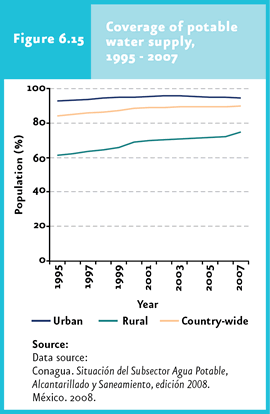
Potable water The coverage of the world´s population with access to sources of water suitable for human consumption is estimated at around 83% (WHO-UNICEF, 2004). However, huge contrasts exist: in countries such as the US, France and Canada, the coverage is virtually 100%, while the average coverage in sub-Saharan Africa barely reaches 56% (WHO-UNICEF, 2004). In Mexico, access to drinking water reached 87.9% in the year 2000 (a figure slightly above the estimate for Latin-America and the Caribbean region (of about 85%; PNUMA, 2003) and, by 2007, this figure increased to 89.9% (Conagua, 2007; IB 2.1-11). Between 2000 and 2007, drinking water coverage in urban areas increased from 94.6 to 94.5%, whereas in rural areas it remained at significantly lower levels, increasing from 68 to 74.7% over the same period of time (Figure 6.15, Cuadro D3_AGUA06_02).
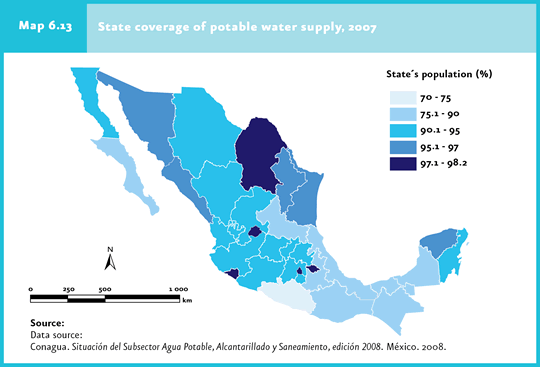
Within the country, over the same period of time, most of the states increased in real terms their coverage of potable water, although important differences remain (Cuadro D3_AGUA06_01). While states such as the Federal District, Aguascalientes, Colima, Coahuila and Tlaxcala had coverage of drinking water service above 97% in 2007, this service was accessible to less than 75% of the population in the state of Guerrero (Map 6.13).
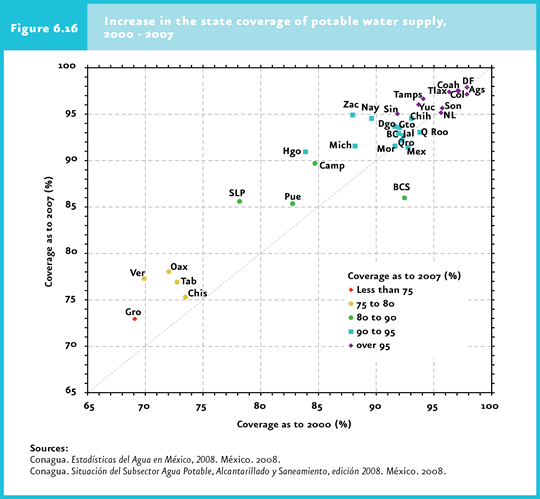
Also noticeable are the differences in efforts to increase drinking water coverage. For example, Veracruz, San Luis Potosi, Zacatecas, Hidalgo, Nayarit, Campeche, Oaxaca, Guerrero and Michoacan increased their potable water coverage in over 5% between 2000 and 2007 (Figure 6.16). By contrast, other states such as Baja California Sur, Quintana Roo and Mexico face a huge challenge, as the increase rates of the potable water service are insufficient to achieve acceptable levels of coverage for an ever-increasing population (Cuadro D3_AGUA06_01).
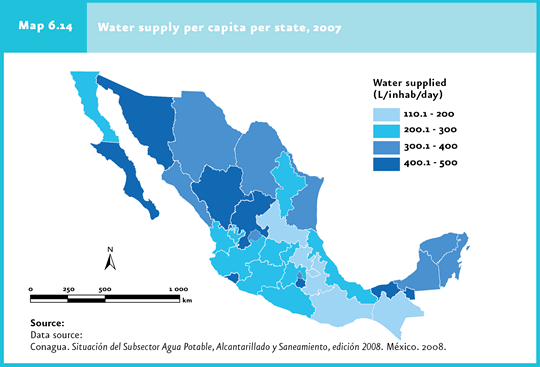
Supply of high quality water is key for the population health and hygiene, so that the construction of water potabilizing facilities is required. In the year 2007, 327 thousand litters of water per second were supplied for human consumption country-wide, 96% of which (315 thousand) were disinfected and 26% (86 thousand) were potabilized, mostly through the complete clarification process (Cuadros D3_AGUA07_02 and D3_AGUA07_05). These figures mean that, on a country-wide average, some 278 litres were supplied, per inhabitant per day, above the UN minimum recommendable levels: 50 litres per inhabitant per day to meet the minimum basic needs (food and personal cleansing) and 100 litres to meet the general needs (FNUAP, 2001). At the state level, that same year, Colima, Morelos, Sonora, Tabasco, Durango, Baja California Sur and Zacatecas had a supply rate above 400 litres per inhabitant per day, whereas in Oaxaca, Hidalgo, Puebla, Tlaxcala, Chiapas and San Luis Potosi it did not exceed 200 litres (Map 6.14).
In the year 2007, the potable water supplied that underwent a complete potabilization process -rather than only disinfection- was, on a country-wide average, 71 litres per capita per day. Tamaulipas had the highest supply rate, with 319 litres of potabilized water per capita per day, whereas states such as Morelos, Nayarit, Quintana Roo, Tlaxcala and Yucatan currently lack potabilizing plants in operation.
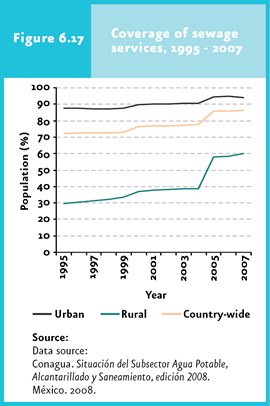
Sewage system Throughout the world, the percentage of the population having access to sewage services increased from 49 to 59 % between 1990 and 2004 (WHO and UNICEF, 2008). However, as it is the case with potable water, dramatic differences exist at a regional level: whereas in Latin America this figure reached 79% on average, in sub-Saharan Africa this was below 31% (UN, 2008). The situation is serious at the world level: the UN (2008) estimates that about 2 thousand 500 million people around the world lack access to sanitation services. In Mexico, the coverage of sewage services was 86.1% in 2007 (IB 2.2-12), above the estimated average, 79%, for Latin America and the Caribbean region (PNUMA, 2003). Similar to the coverage of potable water, there are also dramatic differences in sewage services between urban and rural areas. In the former, coverage reached 94.2% in 2007, whereas in the latter coverage was a mere 59.9% (Figure 6.17).
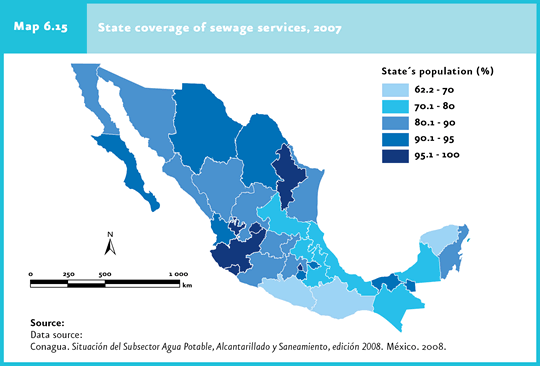
At the state level, the Federal District, Aguascalientes, Colima, Jalisco and Nuevo Leon have coverage above 95%, whereas Oaxaca, Guerrero and Yucatan do not reach 70% (Map 6.15).
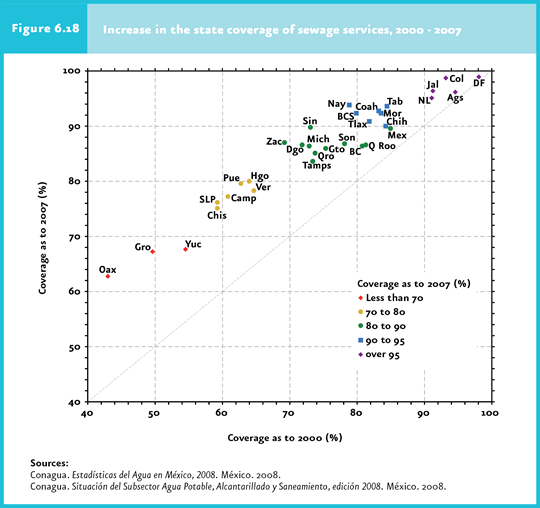
The states with the largest differences as to the coverage of potable water and sewage services are Yucatan (28%), Oaxaca (15%) and Tamaulipas (13%). Although in all the states the coverage of sewage services increased between 2000 and 2007, states such as Oaxaca, Campeche, San Luis Potosi, Puebla, Guerrero, Zacatecas, Sinaloa, Chiapas and Hidalgo stand out with increases higher than 15% (Figure 6.18; Cuadro D3_AGUA06_04).
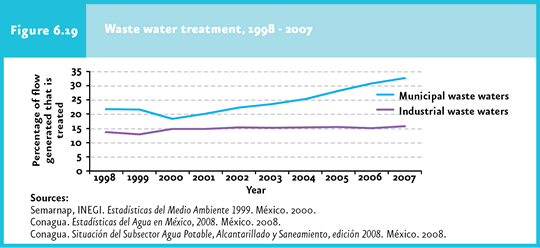
Waste water treatment Waste water treatment is still uncommon in developing countries. Between 85 and 95% of the world’s waste water is discharged directly into rivers, lakes and the sea with no previous treatment (FNUAP, 2001; Vörösmarty et al., 2005). In 2007, Mexico treated nearly 25.3% of the total waste water generated, considering both types of discharges: municipal (32.6% of the municipal total generated) and industrial waste water (15.8%; Figure 6.19). Although the amount of water treated is still low, it is above the average of only 13% for Latin America. It is evident that most of the country’s surface water bodies continuously receive discharges of untreated waste water which lead to pollution and, consequently, affect human and environmental health. It must be kept in mind that the deterioration of water quality of surface and underground water sources aggravates water scarcity, since in many cases that water can no longer be used without previous treatment.
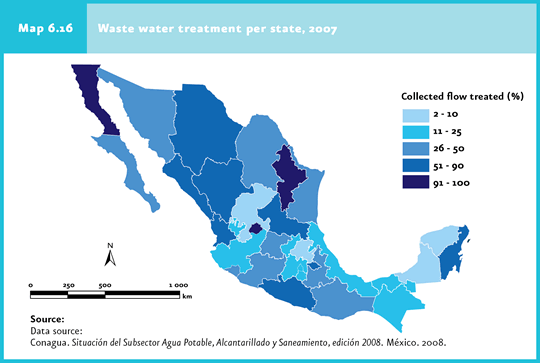
In 2007, the country’s urban centers produced an estimated 243 cubic meters per second of waste water, 85% of which (207m3/s) were collected in sewage systems, representing a 5% increase compared to the volume collected in 2003. Of the volume collected in 2007, 38% (79.3 m3/s) received some type of treatment (Cuadro D3_AGUA07_093). When the collecting efficiency is related to waste water treatment, it turns out that in 2007, only 32.6% of municipal waste waters were treated throughout the country before being discharged into water bodies (Map 6.16, IC 12). Only Nuevo Leon, Baja California and Aguascalientes provide treatment to over 90% of the waste water collected in sewage systems.
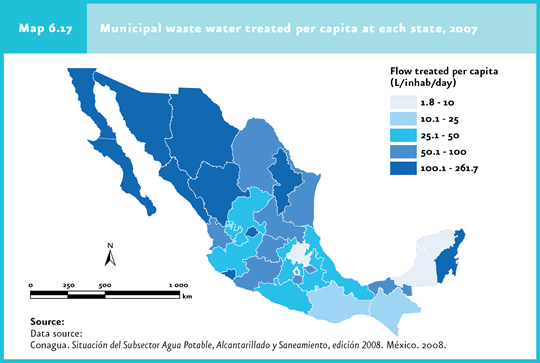
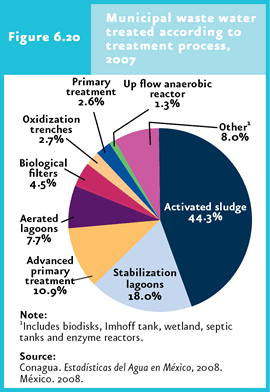
Country-wide, an average of 65 litres of waste water were treated per inhabitant per day, with large differences between states, since Aguascalientes, Baja California, Baja California Sur, Chihuahua, Durango, Quintana Roo, Sonora, Sinaloa, Nayarit, Colima and Nuevo Leon treated volumes above 100 litres per capita per day, whereas Campeche, Hidalgo and Yucatan did not reach 10 litres per capita per day (Map 6.17). Most municipal waste water that is treated in the country receives secondary treatment through activated sludge and stabilization lagoons, processes with an efficiency ranging between 80 and 90% for BOD removal (Figure 6.20; Cuadro D3_AGUA07_093).
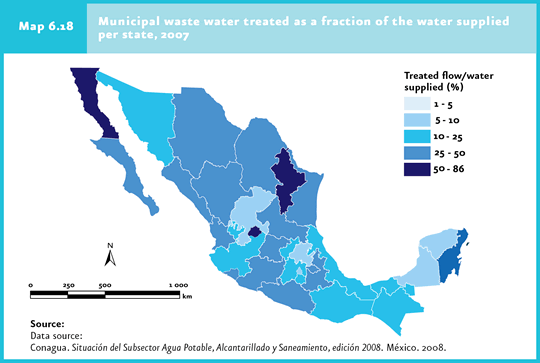
An approximate indicator of the efforts made by states to provide water treatment is the relationship between the volume of water that is supplied to the population and the volume of waste water that is treated. The states that process a higher proportion of the water they provide to the population are Nuevo Leon, Aguascalientes, Quintana Roo and Baja California, with a ratio between waste water treated and water supplied above 50%; by contrast, in Yucatan, Campeche and Hidalgo this is below 6% (Map 6.18).
By December 2007, the country had 2 thousand 21 industrial waste water treatment plants in operation, which processed 29.9 cubic meters per second (16% of the waste water generated). The most frequently used type of treatment is secondary treatment in one thousand 119 plants, involving an operation volume of 15 thousand 90 litres per second. Veracruz is the state that produces the largest volume of waste water, and is also the state processing the largest volumes of waste water, with nearly 30% of the country-wide total, followed by Nuevo Leon, the State of Mexico, Michoacan, Morelos and Jalisco, which provide treatment to over one thousand litres per second (Cuadro D3_AGUA07_13).
|
