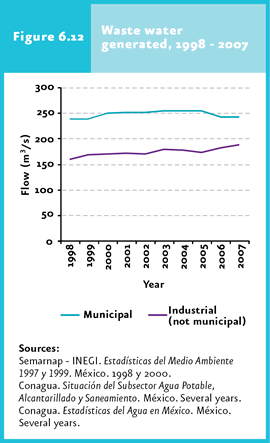
In Mexico, between 1998 and 2007 waste water generation in urban centers increased from 239 to 243 cubic meters per second. |
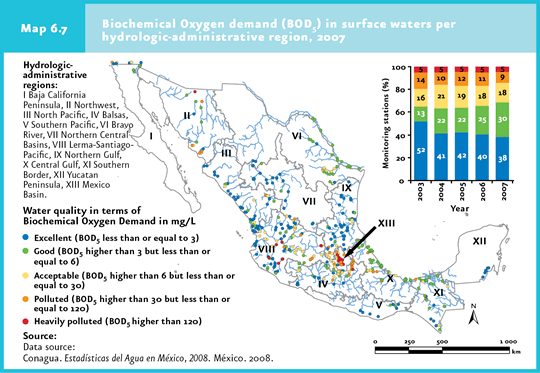
Nearly 14% of the water bodies monitored had DBO5 values exceeding 30 mg/L, a value that this regarded as the maximum permissible level for the protection of aquatic life in rivers. |
| CHAPTER 6. WATER |
The water availability situation does not portray accurately the real magnitude of the water issue. Due to the continuous discharge of untreated waste water loaded with household and industrial pollutants, as well as to the runoff of agrochemicals from farming activities in the different basins, the quality of water in surface and underground bodies is negatively affected, further aggravating the scarcity of water and threatening the health of important segments of the population. In parallel, the degradation and loss of natural ecosystems prevent these from providing the goods and environmental services, including water capture and purification, which makes the water scarcity issue even worse. According to the World Health Organization (WHO), some one thousand 100 million persons, or nearly 17% of the world population, did not have access to potable water in 2002 (WHO, 2004). This occurs mainly in rural areas where almost no possibility exists for water to be treated to increase its quality and make its use possible. High-quality water is an attribute that is defined according to its intended use (either as potable water, for recreation purposes, for agricultural or industrial uses, for example), which necessarily requires the setting of quality standards specific for the different uses (UNDP et al., 2000). For this reason, in order to assess water quality, its intended use has to be considered. Water quality in a given surface or underground body depends on many factors, some of which reduce water quality either directly or indirectly, and others that may reverse the effects of pollutants and, hence, improve water quality. Factors reducing water quality include the direct discharge of waste water or solid wastes from household, farming or industrial activities. Indirectly, the improper disposal of urban or hazardous solid wastes on land may cause lotic or lentic water bodies to be polluted by surface runoff, and aquifers to be polluted by leachates. On the other hand, the natural capacity of aquatic ecosystems to decompose or immobilize pollutants works for the improvement of water quality; this capacity, however, might be exceeded (either by the pollutant load itself or by the degradation of ecosystems), thus threatening aquatic biodiversity and its potential to supply these and other environmental services (Vörösmarty et al., 2005).
Waste water discharge Waste water from urban sources comes from households, public buildings and urban runoff that is collected in the sewage system. The main pollutants include nutrients (Nitrogen and Phosphorus), pathogens (bacteria and viruses), biodegradable organic matter, heavy metals, synthetic organic chemicals, hormones and pharmaceutical products (Silk y Ciruna, 2004). Many pollutants can be absorbed and build up in tissues of aquatic organisms (including both plants and animals), thus affecting the food chain, species abundance and the structure of biological communities. In Mexico, the volume of waste water from urban centers was 7.66 cubic kilometers in 2007. This volume has increased along with the growth of the population and urbanization: between 1998 and 2007, waste water generation in urban centers increased from 239 to 243 cubic meters per second (Figure 6.12; IB 2.2-1).
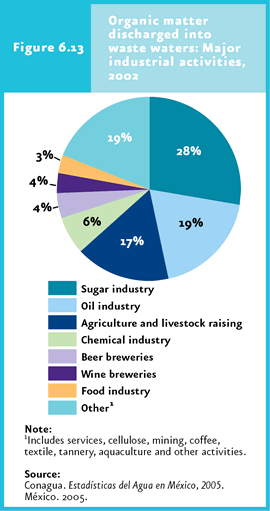
On the other hand, in 2007, 5.98 cubic kilometers (that is, nearly 188.7 m3/s; IB 2.2-2) of non-municipal waste water were discharged, which represents 6.95 million tons of BOD per year (Cuadro D3_AGUA07_10). Discharges to water bodies have not increased significantly over the past years in the country: between the year 2000 and 2007, waste water discharge increased in 19 cubic meters per second, an increase of 11% over the volume discharged in the year 2000. Industrial discharges come mainly from the chemical, sugar, mining, oil, iron and steel, cellulose, paper, textile and aquaculture industries (Cuadro D3_AGUA07_10). Based on the amount of organic matter discharged, the major contributing industries are the sugar-producing (28%), oil (19%), and farming industries (17%; Figure 6.13).
Monitoring of water quality The National Water Commission (Conagua in Spanish) conducts a systematic measurement of water quality through its National Monitoring Network (RNM in Spanish). In the year 2007, RNM had one thousand 14 sampling sites, 389 of which corresponded to the primary network, with 207 located in surface water bodies, 52 in coastal areas and 130 in aquifers. The secondary network included 285 stations, 241 of which were located in surface waters, 19 coastal areas and 25 in underground water. The rest belongs to the special study network (251) and to the groundwater reference network (89). It is worth mentioning that the sites where water quality is monitored are located in the major water bodies of the country, including zones with a high anthropogenic influence (Cuadro D3_R_AGUA05_03). Currently, Conagua publishes its main indicators of water quality: the 5-day biochemical Oxygen demand (DBO5), chemical Oxygen demand (DQO) and total concentration of suspended solids (SST). These variables reveal the human influence derived from the presence of urban and industrial centers. Other water quality parameters recorded in most RNM sites are the concentration of nitrate (IB 2.2-11) and phosphate2 (IB 2.2-10), hardness, dissolved Oxygen and pH. The biochemical oxygen demand is used as an indicator of the amount of biodegradable organic matter present in water (IB 2.2-9 and IC 13). The increase in organic matter causes a reduction in the content of dissolved Oxygen in water bodies (which leads to “anoxic” conditions), with negative effects for the biological communities living in aquatic ecosystems. In 2007, 38% of the monitoring sites had a biochemical oxygen demand below 3 mg/L (which is regarded as the limit value for an excellent water quality), a figure 14% lower than the one registered in 2003. Nevertheless, nearly 14% of the water bodies monitored had DBO5 values higher than 30 mg/L, which is considered the maximum permissible level for the protection of aquatic life in rivers (Map 6.7; Cuadro D3_AGUA05_02). Most of the stations with high DBO5 values (exceeding 30 mg/L) were located in the central part of the country: in the Aguas del Valle de Mexico, Northwestern and Balsas regions; in 72, 50 an 26% of their stations, respectively, average values exceeding 30 mg/L were recorded in 2006 (Map 6.7).
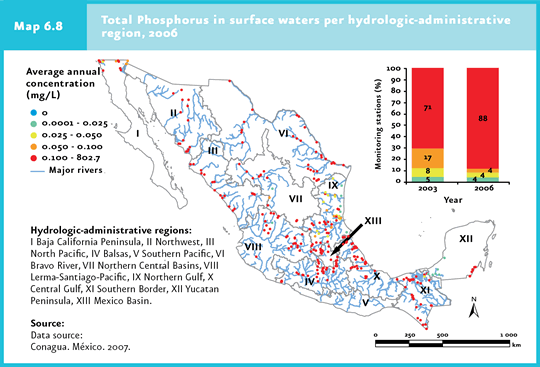
Another pollutant frequently detected in water bodies are phosphates, which generally come from chemicals applied as fertilizers in agricultural areas and from detergents used in urban areas, although these also derive from soil erosion and decomposing organic matter discharged by industries, households and farms. Although phosphates are not intrinsically toxic for humans and animals, they may have indirect negative effects through the eutrophication of surface water bodies, which involves the explosive growth of algae with the subsequent depletion of dissolved Oxygen (Carpenter et al., 1998). In the year 2006, the total phosphate concentration exceeded 0.1 mg/L3 in over 88% of the country’s monitoring sites. In the case of the Northwestern, Northern Pacific, Balsas, Central Gulf and Aguas de Valle de Mexico hydrological-administrative regions, this limit was exceeded in 100% of the sites monitored (Map 6.8).
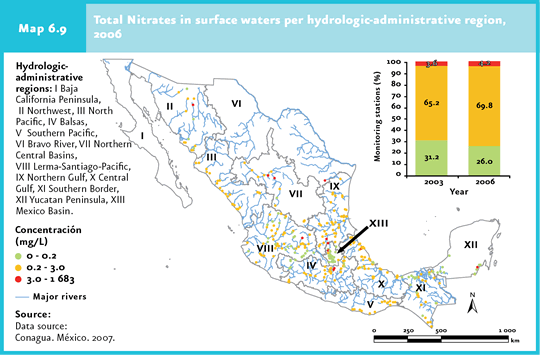
Nitrates are important components of fertilizers that can also derive from the oxidization of ammonium (NH4+) and other sources present in organic waste. Nitrates have adverse effects on human health, causing cyanosis and even asphyxiation. In the year 2006, concentrations above 0.2 mg/L4 were recorded in 74% of RNM monitoring sites (Map 6.9). In the Northern Pacific, Balsas, Southern Pacific, Northern Central Basins, Northern Gulf and Central Gulf regions, more than 75% of the monitoring sites exceeded this threshold. That same year, 7.7% of the monitoring sites located in the Northern Central Basins region had nitrate concentrations above 5 mg/L, a level which might favour the growth of algae and the reduction of Oxygen levels in aquatic ecosystems.
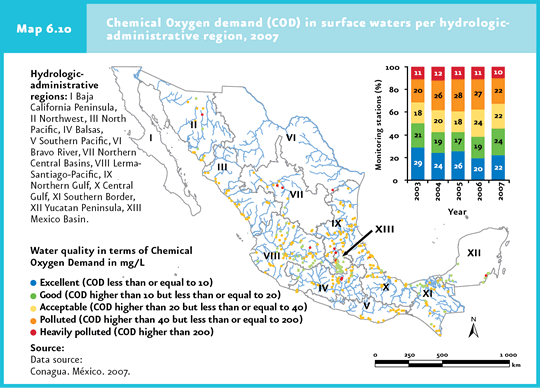
The increase in chemical Oxygen demand suggests the presence of chemicals from non-municipal discharges. Values above 40 mg/L indicate the presence of raw waste water discharges. In the year 2007, the mean annual concentration in 32% of monitoring sites exceeded this limit, and nearly one third of these had mean values above 200 mg/L (Map 6.10). In the Baja California Peninsula, Northeastern, Balsas, Lerma-Santiago-Pacific and Aguas del Valle de Mexico regions, over half of the monitoring sites had a mean annual concentration above 40 mg/L (Map 6.10).
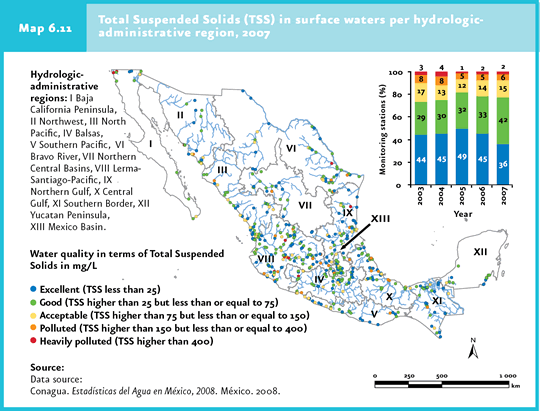
Sediments accumulate in water bodies both, for natural reasons, and as a consequence of human activities. When this occurs in an excessive way, it can have serious effects on the hydrological resources of the region. Forest clearing, the transformation of natural ecosystems into agricultural or ranching land, urbanization and the construction of new roads often lead to a higher soil erosion and intense transport of sediments and pollutants to creeks. The increase in the sediment load has negative consequences for aquatic ecosystems (affecting benthonic organisms living in rivers´ floors, disrupting food availability and fish survival), but also has effects on water management: it accelerates the wearing of bombs and turbines, reduces the life cycle of hydro electrical facilities and increases the maintenance costs of irrigation systems. In the country, 40 of the 501 monitoring stations in which total suspended solids were recorded in 2007, were considered as contaminated (5.8% ) or heavily contaminated (2.2%; Map 6.11).
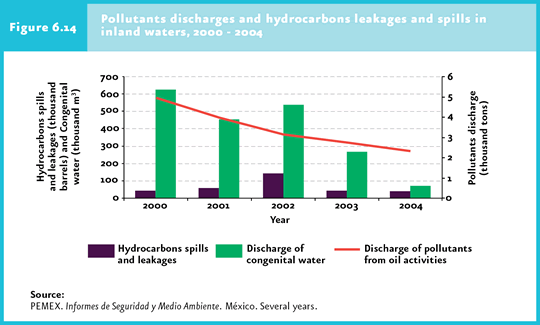
Another type of pollution for which information is available is that caused by oil and petroleum, derived from accidental spills, leaks from transportation networks or derived from the everyday discharge during oil operations. This type of pollution is strongly damaging for the environment, since most aquatic species are highly susceptible to direct contact with hydrocarbons and their water-soluble derivatives. In general, the discharge of congenital5 water and pollutants derived from oil activities decreased between 2000 and 2004. By contrast, the volume of spills and leaks had a considerable increase in the year 2002 (Figure 6.14; IB 6.2-3).
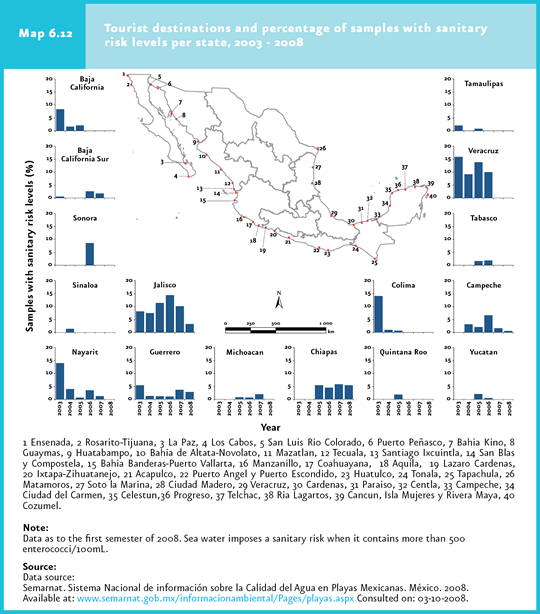
Polluted water flowing in rivers and streams not only affects the populations and ecosystems that make use of or are established along them, but also those located in the coastal areas where the rivers outflow. Many pollutants reach the sea and may have a negative effect on marine ecosystems and human health, depending on their concentration and time of exposure. The most common damages to human health that may be caused by swimming in polluted water include gastrointestinal diseases, skin irritation and eye and ear infections. Although these infections are not serious in general, tourism may be affected when beaches lack the water quality demanded by visitors. In order to monitor and improve the bacteriological water quality in several beach destinations, in the year 2003 the Integrated Clean Beach Program and the National Information System on Water Quality in Mexican Beaches were implemented, with the participation of the ministries of the Sea (Semar), of Environment and Natural Resources (Semarnat), Health (SS) and Tourism (Sectur). Under this program, a systematic and consistent monitoring of sea water quality is conducted according to the criteria established by the World Health Organization for recreation purposes. This system currently has state health laboratories which follow the guidelines established by the Ministry of Health and, in coordination with the Ministry, conduct the water sampling and analyses at each of the 17 coastal states of Mexico. Due to the technical and economical difficulties to determine all the parameters relevant to water quality, enterococci are used as indicator of sea water pollution and the sanitary risks involved in its use for recreation. According to Conagua, samples containing between 201 and 500 enterococci in 100 milliliters are not recommended for recreational use, whereas values above 500 enterococci already represent a health risk. The number of sample sites has increased through time: whereas in the year 2003 only 209 sites were sampled, the number increased to 302 in 2008. In this period of time, 94% of the sea water samples collected throughout the country met the acceptable water criteria (that is, these were suitable for recreational use). Between the years 2003 and 2008, the states with the highest number of sampling sites that failed to meet the water quality standards were Jalisco (with 9% of the total samples in this period), Chiapas (5%), Campeche, Veracruz and Sonora (3% in each of them; Map 6.12). It should be noticed that, since the program was launched in 2003, most states have shown an improvement in water quality.
Notes 2The maximum allowable concentration of nitrate and phosphate in supply sources of potable water are 5mg/L and 0.1 mg/L, respectively. 3The maximum concentration to prevent the development of undesirable biological species and control the accelerated eutrophication of rivers and streams is 0.1 mg/L (DOF, 1989). 4A maximum concentration of 0.2 mg/L for long term consumption is set, in order to prevent metahaemoglobinemia in children (WHO, 2004). 5This is the salty water embedded within rock, associated to hydrocarbons. This water contains dissolved salts and even some metals that may have a negative environmental impact.
|
