The rise in mean temperature observed since the mid-20th century to date is most likely due to a rise in GHG concentrations derived from human activities. |
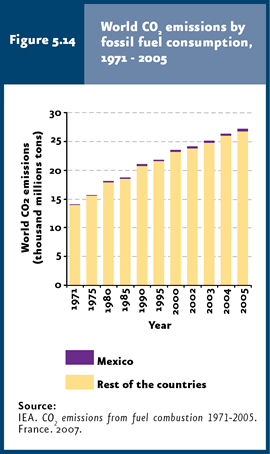
During 1971-2005, world emissions derived from fossil-fuel consumption and burn underwent a 90% increase. In 2005, Mexico contributed some 1.4% to world GHG emissions, ranking among the top 15 countries in terms of emission volumes. |
In 2002, GHG emissions amounted to 553 million tons of CO2 equivalent countrywise, approximately (not considering emissions derived from land use, changes in land use and forest practices). If all sources are considered, this figure increases to 643.2 million tons of CO2 equivalent. |
CO2 released at a country level came mostly from fossil fuel consumption (88%). |
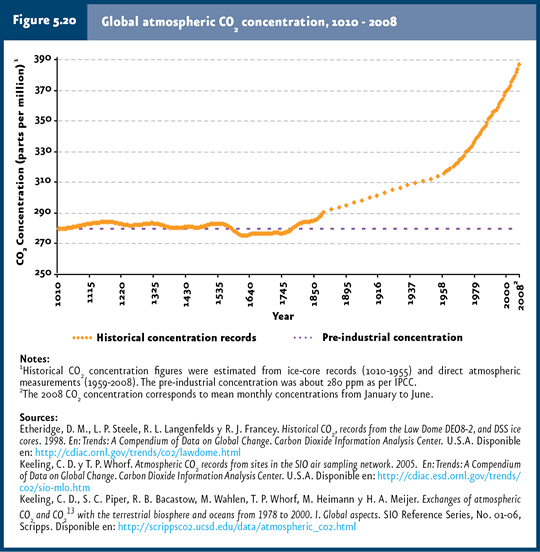
CO2 concentration in 2008 reached 386 ppm, 38% above the pre-industrial level. |
The total temperature rise between 1850-1899 and 2001-2005 was 0.76ºC. |
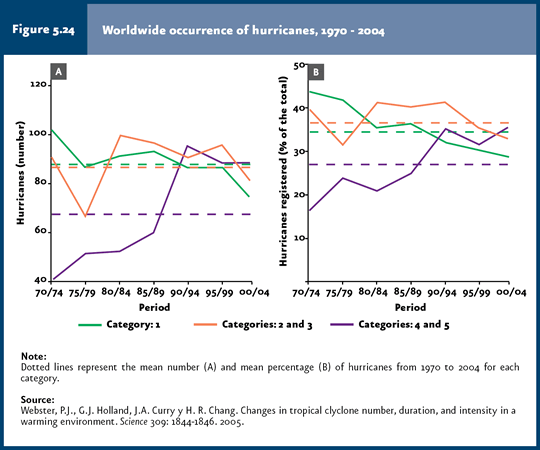
The most intense hurricanes doubled their number and proportion over the past decade. |
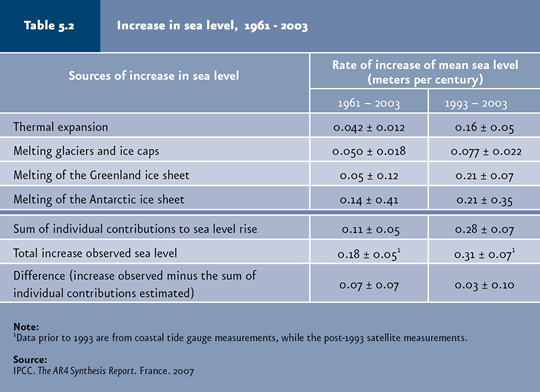
Mean sea level rose 1.8 mm per year during 1961-2003. |
Projections indicate that the global CO2 concentration might range between 540 and 970 parts per million (ppm), global mean surface sea temperature will be 1.8 – 4ºC higher and the sea level will rise between 18 and 59 centimeters by the end of this century. |
Mean temperature in Mexico will be 2°C to 4°C higher by the year 2080. |
National water availability may decrease by 10% between the years 2020 and 2030 relative to the year 2000. Baja California and Sonora will face a critical situation in terms of demand of water resources.
|
By late 2008, 182 countries had ratified, approved or accepted the Kyoto Protocol; these jointly represent 67.7% of GHG emissions from developed nations. |
| CHAPTER 5. ATMOSPHERE |
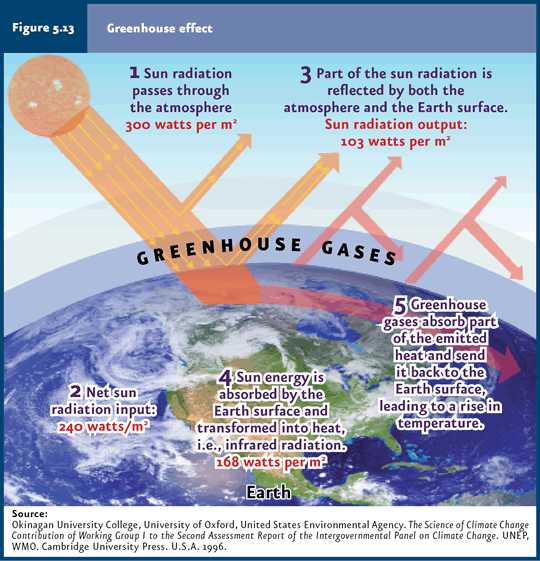
Today, climate change is one of the world’s core environmental issues, with implications beyond the environmental area, since its projected effects may bring about serious economic, social and political consequences. Understanding this phenomenon requires determining both the scientific basis of the issue as well as the causes and likely effects associated with it. The atmosphere is naturally constituted primarily by oxygen and nitrogen that jointly account for 99.03% of the atmosphere composition. Argon represents 0.93% of total gases. Additionally, there are other gases in lower amounts – carbon dioxide (CO2), water vapor, ozone (O3), methane (CH4) and nitrous oxide (N2O) -, known as greenhouse gases (GHGs) because of their capability to absorb heat. The Earth’s climate, and particularly temperature, depends on the balance between sun energy reaching the planet and heat (infrared radiation) emitted by it. GHGs let sun radiation pass through the atmosphere with virtually no problem, but absorb infrared radiation emitted by the Earth’s surface; these gases even irradiate again part of the heat back to Earth, causing a net heating effect similar to the one in greenhouses (Figure 5.13; Cuadro D3_R_AIRE02_01). Without this phenomenon, temperature at the Earth surface would be 33ºC colder, on average, and life would have likely not been developed or would be markedly different from what we know today.
Climate is a complex and far-from-constant phenomenon, since although there are long-term trends, natural fluctuations also occur that become evident at variable time intervals. Annual changes in climate (seasons), as well as those that have occurred over longer periods of time, result from natural variations (Refer to Box What causes climate change?). Throughout the Earth’s history, periods have been recorded where glaciations or higher temperatures have occurred. However, the climate change that is currently taking place is attributed mostly to human activities. The Intergovernmental Panel on Climate Change (IPCC) defined climate change as “…any change in climate through time, either due to natural variability or resulting from human activities” (IPCC, 2007b). Although there are several factors which may affect climate, in its 2007 4th Assessment Report (AR4) IPCC concluded that the rise in mean temperature observed since the mid-20th century to date is most likely6 due to a rise in greenhouse gas concentrations derived from human activities (IPCC, 2007a).
Anthropogenic GHG Emissions Greenhouse gases are released from both natural sources and human activities. However, among the latter, the main source is fossil fuel combustion. From the Industrial Revolution, which started in the eighteenth century, the production of goods and services rose significantly, creating a greater demand and consumption of fossil fuels which produced gases that, upon reaching the atmosphere, led to a rise in GHG concentration; according to scientific evidence, this rise fosters global warming and climate change (IPCC, 2007a). CO2 is the chief GHG due to the large volumes released, its long life in the atmosphere (5-200 years), its radiative forcing7 (1.3 – 1.5 Wm-2) and the remarkable increase in its concentration in the atmosphere (35% up from preindustrial levels). This gas has been assigned a heating potential of 1 and is used as reference for establishing the potential of all other GHGs (IPCC, 2001; NAS, 2001).
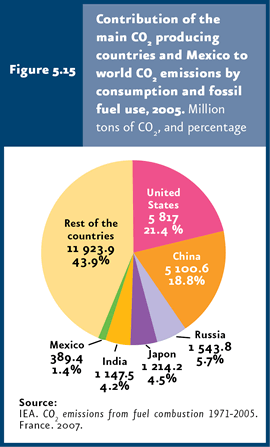
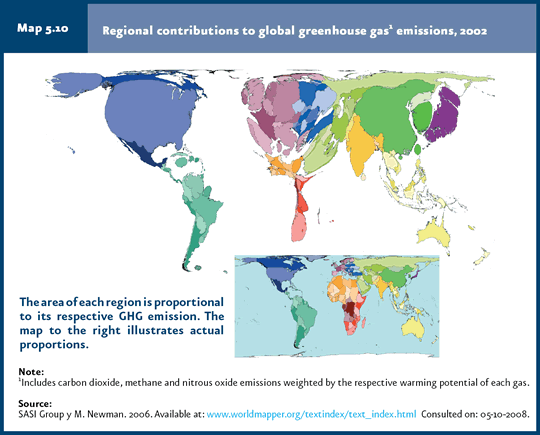
World Emissions CO2 emissions have rose as a direct consequence of fossil fuel combustion and changes in land use. During 1971-2005, world emissions derived from fossil-fuel consumption and burn underwent a 90% increase (Figure 5.14, IB 1.2-1). In 2005, Mexico contributed some 1.4% to world GHG emissions, ranking among the top 15 countries in terms of emission volumes. In 2005, five countries accounted for about one half of CO2released worldwide from fossil-fuel consumption and burn (Figure 5.15). Around 27 thousand million tons of CO2 were produced that year, of which 14 thousand 823 (54.6%) came from the United States, China, Russia, Japan and India. The cases of the US and China are worth highlighting, as both countries accounted for 22% and 19% of global emissions that year, respectively. Mexico’s contribution represents between 0.7 and 1.43% of total emissions (Figures 5.14 and 5.15). If carbon dioxide, methane and nitrous oxide emissions are taken into account, the relative contribution of a number of regions is (besides North America, which contributed 26% to total emissions): Eastern Asia (15%), Western Europe (14%) and the Middle East (13%; Map 5.10).
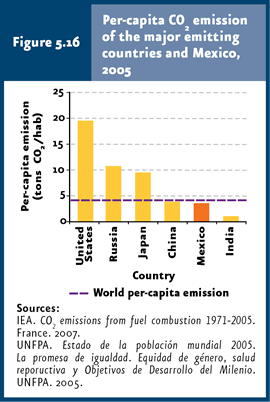
When emissions are analyzed on a per capita basis, it is evident that the United States is responsible for emissions nearly five-fold the world per-capita average (19.5 vs. 4.12 tons of CO2 per capita; Figure 5.16). Russia and Japan have per-capita emissions slightly above twice the world figure, whereas China and India have emissions below the mean world figure (IEA, 2007; UNFPA, 2005). As for Mexico, figures range between 3.6 and 3.9 tons of CO2 per person (ranking 69 worldwide), depending on the source of emission data used (IEA, 2007; Semarnat, INE, 2006a).
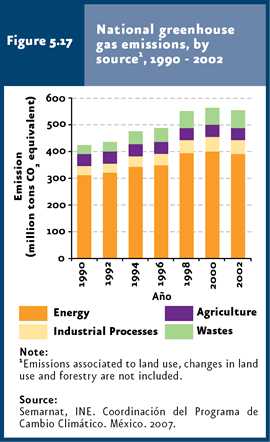
Emissions in Mexico The first estimate of greenhouse gas emissions for Mexico was published in 1995 including 1990 data. These data were presented to the 1997 United Nations Framework Convention on Climate Change as part of Mexico’s First National Communication to the Convention. Later, in the Second National Communication (2001), emissions were calculated for 1994, 1996 and 1998 using the methodology reviewed by IPCC in 1996. The Third National Communication was presented in 2006, including the national inventory recalculated for 1990-2002. To note, as a result of methodological changes, comparisons between inventories are not recommended, so that this chapter focus only on data reported in the most recent published inventory. According to the latest National Inventory on Greenhouse Gas Emissions (INEGEI in Spanish), total GHG emissions underwent a 30% rise between 1990 and 2002. This latter year GHG emissions amounted to 553 million tons of CO2 equivalent8 countrywise, approximately (not considering emissions derived from land use, changes in land use and forest practices). INEGEI details that the energy sector (including fossil fuel consumption and fugitive emissions9) released over 70% (389.5 million tons of CO2equivalent) of total GHGs in 2002 (Figure 5.17, Cuadro D3_AIRE02_01). In this sector, fossil fuel consumption represented the main GHG emission source in the country, contributing a little over 63% to total emissions.
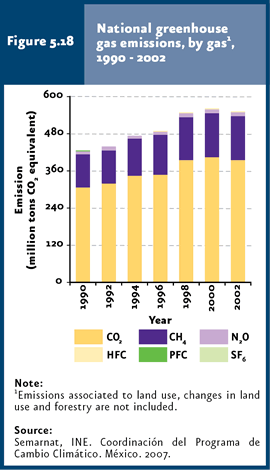
In 2002, emissions derived from wastes (solid waste disposal in landfills, wastewater management and treatment and waste incineration) jointly released 11.9% of total GHGs (65.6 million tons of CO2 equivalent), while industries and agriculture released 9.4 and 8.3% (52.1 and 46.1 million tons of CO2 equivalent) of the national total, respectively. When this analysis considers the six main GHGs contemplated in the Kyoto Protocol10– CO2 (carbon dioxide), CH4 (methane), N2O (nitrous oxide), HFC (hydrofluorocarbons), PFC (perfluorocarbons) and SF6 (sulfur hexafluoride)-, CO2 turns out the main pollutant released at a national level (71% of total GHGs; Figure 5.18, Cuadro D3_AIRE02_01), followed by methane, with some 25% of total.
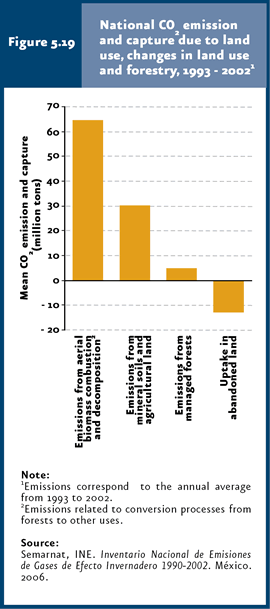
About 88% of released CO2 came from fossil fuel consumption. Methane derived primarily (44%) from solid waste disposal in landfills and wastewater management and treatment (Cuadro D3_AIRE02_01), although agriculture and fugitive emissions also released significant amounts (around 27% of total emissions each). Calculations of GHG emissions for 1990-2002, as reported in INEGEI, include no emissions derived from land use, changes in land use or forestry (USCUSS). INEGEI reports an interim average annual estimate of 89.8 million tons of CO2 equivalent for 1993-2002. This estimate includes biomass combustion and breakdown linked to the conversion of forests and natural vegetation areas to other uses as main sources. If all these sources are taken into account (including USCUSS), national total GHGs released in 2002 would rise to 643.2 million tons of CO2 equivalent, with USCUSS contribution representing 14% of this total. This estimate is relevant since, besides representing a high percentage of emissions, there is evidence that changes in land use have contributed large amounts of GHGs in the past; it is calculated that soil carbon levels undergo a 50-60% drop after 50 to 100 years of agricultural use (Stewart & Robinson, 2000). When only CO2 emissions are considered, USCUSS represent a total of 86.9 million tons. These emissions result from a balance between CO2 emission and uptake; on the one hand, emissions from aerial biomass burning and breakdown (64.5 million tons), mineral soils and agricultural land (30.4 million tons), and managed forests (4.9 million tons) are accounted for; on the other, CO2 uptake in abandoned land (12.9 million tons) is substracted (Figure 5.9; IB 1.2-3; Semarnat, INE, 2006a).
According to INEGEI, between 1990 and 2002 national emissions of virtually all GHGs increased, CO2 being the most important in terms of volume, with a 28% rise. CH4 and N2O underwent a 34% and 16% rise, respectively. By contrast, PFC emissions declined by 42%. Although HFC and SF6 displayed a substantial rise (about 10,000% and 541%, respectively) between 1990 and 2002, the fact that volumes released are small relative to other gases should be taken into account. Within the world context, if CO2 generation is examined considering the country’s Gross Domestic Product (GDP), Mexico (with a value of 0.61 kg CO2/USD at 2000 prices) ranked 13th among OECD countries in 2005, below the Czech Republic, Poland, Slovakia and Hungary, among others (OECD, 2007). This emissions intensity was lower than those in 2000 and 2002 (0.96 and 0.97 kg CO2/USD at 1995 price; OECD, 2002, 2004), translating into a better production efficiency. According to OECD, net per capita CO2 emissions in Mexico were 3.7 tons/year in 2005, placing Mexico as the country with the second lowest per capita CO2 emissions among OECD countries, well below Luxembourg, US, Australia and Canada, with 24.83, 19.61, 18.4 and 17 ton/year, respectively (OECD, 2007). Within Latin America, countries like Trinidad and Tobago and Venezuela surpass Mexico in per-capita volumes of emissions (IEA, OECD, 2008). There are other greenhouse gases which, despite being released at levels well below those of CO2, significantly contribute to global warming, as their combined effect in terms of heat retention and permanence time in the atmosphere translate into substantial effects. For instance, chlorofluorocarbons (CFCs), regarded as chemicals that destroy the stratosphere’s ozone layer, may remain in the atmosphere for up to 1700 years, whereas fluorocarbons may do so for 50 thousand years. Halocarbons, including halons and CFCs, have a radiative forcing of 0.34 Wm-2, equivalent to 14% of the radiative forcing of all GHGs combined at a world level (Refer to Box Are climate change and ozone-layer thinning related? under the Stratosphere Ozone section in this chapter; IPCC, 2001).
GHG concentration in the atmosphere The accumulation of CO2 in the atmosphere is due to the fact that natural depots (e. g. vegetation and water bodies) are insufficient to capture the increasing emissions of this gas. Consequently, CO2 levels in the atmosphere have risen significantly. Since CO2 is dispersed easily, measurements taken anywhere in the planet are representative. The most extensive and reliable historical record corresponds to the Mauna Loa region, Hawaii, so that data gathered in this location are deemed representative of global CO2 levels (Keeling & Whorf, 2005). Figure 5.20 (IB 1.2-4) shows that the atmospheric CO2 constant remained relatively unchanged during preindustrial times and displayed an evident rise from the eighteenth century, with a marked acceleration in the second half of the twentieth century. The pre-industrial CO2 concentration was about 280 parts per million (ppm), reaching 386 ppm in 2008, equivalent to a 38% rise. According to IPCC, atmospheric CO2 concentration in 2005 was well above the natural concentration over the past 650 thousand years (180 to 300 ppm; IPCC, 2007a).
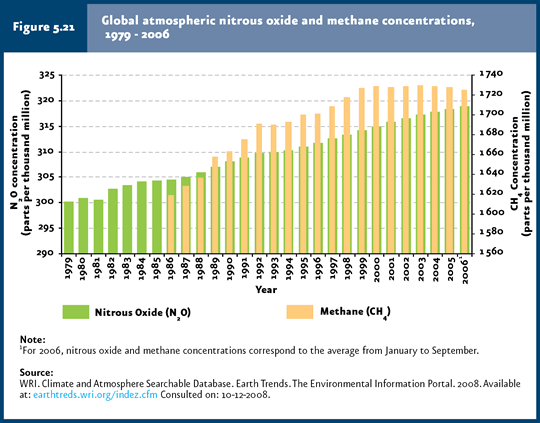
The concentration of other gases, such as nitrous oxide (N2O) and methane (CH4), has also increased significantly over the past years. CH4 went from 715 parts per thousand million (pptm) in pre-industrial times to one thousand 725 pptm in 2006 (Figure 5.21). N2O levels rose from 270 to 319 pptm over the same period of time.
In general terms, it has been estimated that CO2 accounts for approximately 60% of the greenhouse effect accumulated since the eighteenth century, while other gases contribute as follows: CH4, 20%; N2O, 6%; and halocarbons, 14% (IPCC, 2001; PNUMA, 2002). CO2 radiative forcing experienced a 20% rise from 1995 to 2005, representing the highest change per decade over the past 200 years (IPCC, 2007a). According to the latest IPCC assessment, the combined ratiative forcing due to increases in CO2, CH4 and N2O is 2.30 Wm-2, and the increase rate over the industrial era is likely unprecedented during the past 10 thousand years.
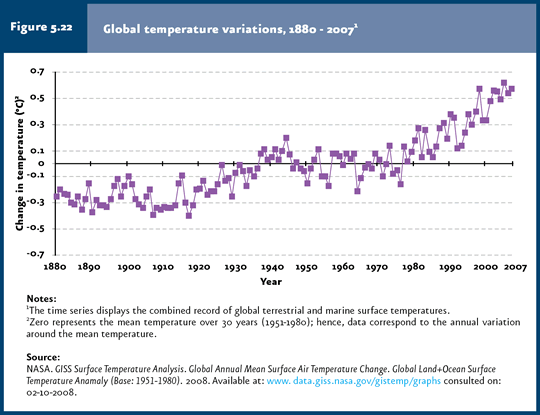
Evidence of Climate Change Evidence of climate change, both at global and regional scales, basically include rises in temperature (atmospheric and surface sea temperature), atmospheric water vapor and sea level, as well as changes in precipitation, wind and atmospheric and ocean circulation patterns (higher frequency, persistence and intensity of the El Niño Southern Oscillation; Magaña, 1999; NAS, 2001; IPCC, 2007b). The rise in temperature is one of the most convincing evidence of climate change. Just during 1995-2005 eleven of the twelve warmest years since 1850 were recorded. According to global temperature records in the past ten years, average variation was nearly 0.5ºC above the average for 1951-1980, 2005 being the year with the highest increase (0.62ºC), even above 1998, which had previously been the warmest year (0.57ºC) recorded at that time, influenced by the 1997-1998 El Niño phenomenon. In 2007, temperature rose 0.57ºC relative to the average (Figure 5.22; IB 1.2-5). According to IPCC, the warming trend over the past 50 years (0.13ºC/decade) is nearly twice the trend observed during the past 100 years. The total temperature rise between 1850-1899 and 2001-2005 was 0.76ºC (IPCC, 2007a).
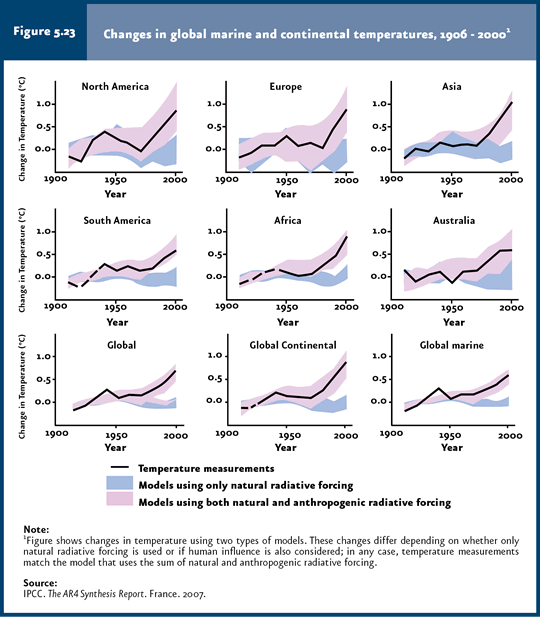
Regionally, the IPCC assessment points out that the temperature rise has been higher in the northern hemisphere. The mean temperature increase rate in the Arctic was nearly twice the global rate during the past 100 years. For its part, continental regions have undergone a faster warming relative to oceans, with the highest rates recorded in North America, Europe and Asia (Figure 5.23).
Records show that heat waves have increased in both frequency and duration worldwide. In the summer of 2003, Western and Central Europe faced an intense heat wave that killed 35 thousand persons. That was the warmest summer recorded since 1780. Besides the instrumental temperature records, there are also temperature estimates available for the planet dating back from thousand years ago. Paleoclimatologists have rebuilt the past climate from ice samples known as “ice witnesses”, which contain air bubbles that trapped a fraction of the ancient atmosphere at the time these were formed. By analyzing them, temperature and the concentration of oxygen, CO2, CH4 and sulfur oxides can be derived (among other parameters). This information has allowed to establish, besides a positive correlation between temperature and GHG concentration (particularly CO2), that current concentrations have no precedent, at least over the past half million years. When both instrumental records and estimated temperature data are factored in, it becomes evident that the Earth has gone through very low temperature cycles – denominated glaciations – and peaks in which temperature has increased. However, global average temperature records for the past years surpass any temperature peaks observed over at least the past twenty thousand years. Instrumental records from 1961 indicate that global mean sea temperature has risen, with changes even at depths of up to 3000 meters. This warmth derives from the fact that oceans absorb around 80% of the heat added to the climate system (IPCC, 2007b). This temperature rise leads to the expansion of sea water bodies, thereby contributing to a rise in sea level. Despite the world heating trend, it is worth stressing that this phenomenon has not taken place evenly throughout the whole planet. For example, areas in the North Atlantic, North Pacific and Central Pacific became cooler over the past 50 years (IPCC, 2007b), following an opposite pattern to the global warming trend. Since hurricane intensity is influenced by sea temperature, the number of intense hurricanes has increased since 1970. At a global level, the number of Category 1 hurricanes11 has remained relatively unchanged; however, when the percentage of total hurricanes recorded is factored in, this figure reveals an evident drop. By contrast, most severe hurricanes (Categories 4 and 5) virtually doubled their number and proportion over the past decade (Webster et al., 2005; Figure 5.24).
The rise in mean sea level is consistent with the consequences predicted under a global warming scenario. The world mean rise in sea level was 1.8 mm/year for the period 1961-2003 (ranging from 1.3 to 2.3 mm; Table 5.2). In 1993-2003, however, mean increase rate reached 3.1 mm (2.4 – 3.8 mm) per year. Table 5.2 summarizes the contributions to rise in sea level associated with melting of polar caps, glaciers and both Greenland and Antarctica ice sheets. The total mean rise in sea level for the twentieth century has been estimated at 17 cm (12 – 22 cm) (IPCC, 2007a). This increase may seem modest, but considering that there are multiple cities located in low coastlines and even below the sea level (such as Amsterdam, The Netherlands, averaging 4 meters below sea level), even small shifts in sea level may involve significant effects.
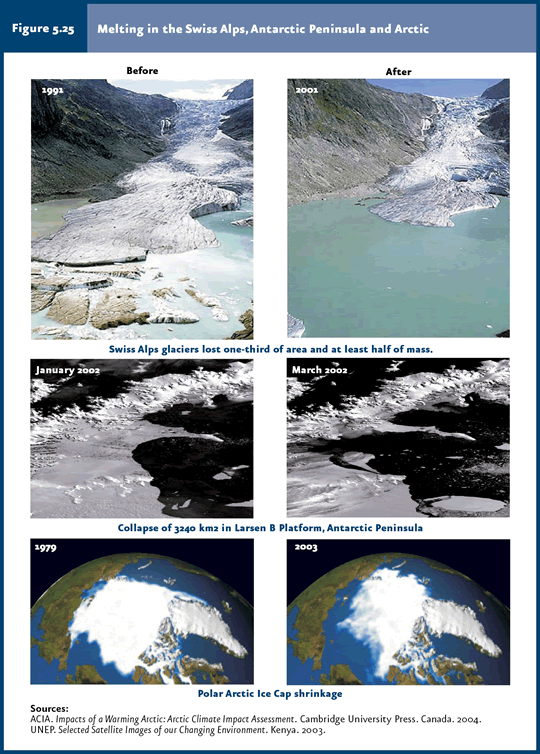
During the twentieth century, glaciers and ice caps experienced a significant mass loss and contributed to the rise in sea level. Mountain glacier and snow cover have declined in both hemispheres: the maximum area covered by seasonally frozen land has dropped nearly 7% in the Northern hemisphere since 1900. For their part, satellite data show that the extension of Arctic sea ice has decreased by 2.7% per decade (ranging from 2.1 to 3.3%) since 1978. In the Antarctica, the Larsen B platform fractured in 2002, leading to deattachment and disintegration of an ice mass of 3 thousand 240 square kilometers (Figure 5.25). Melting has also affected mountain and volcano peaks. For instance, Swiss Alps glaciers lost one third of area and at least half of mass during 1850-1980. Should this trend continue, 75% of glaciers in the Alps will disappear by 2050 (EEA, 2004). In Mexico, Iztaccihuatl glaciers shrunk in up to 40% between 1960 and 1983. The Pico de Orizaba and Popocatepetl volcanoes display a similar trend, although this reduction was faster in the latter as a result of its volcanic activity. If the current rates in the reduction of Mexican glaciers continue, these will likely disappear completely in less than 30 years (Delgado, 2007).
Likewise, the surface temperature of the Arctic permafrost layer12 has risen (up to 3ºC) since the 1980s. Changes in permafrost may affect river runoff, water supplies, carbon exchange, landscape stability and road infrastructure (IPCC, 2007b). As to disturbances in the hydrological cycle, the specific surface humidity rose in close relation with the rise in terrestrial and sea temperatures. The total water vapor column underwent a 1.2% rise per decade in oceans worldwide between 1988 and 2004. Additional atmospheric water vapor involves an increase in vapor available for precipitation in some areas of the world. For example, a significant increase in precipitation has been observed in Eastern portions of North and South America, Northern Europe and Northern and Central Asia. It is probable13 that heavy precipitation has increased in broad portions of the Earth from 1950, even in regions where the total volume of precipitation decreased. Furthermore, more severe and prolonged droughts have also been recorded from 1970 (IPCC, 2007a), mainly in tropical and subtropical areas. In Mexico, a trend towards heavier precipitation during the latest decades is evident, mostly in the Northern states, whereas the opposite trend seems to be the case in the States where rainfall depends on events in the Pacific Ocean (e. g. Jalisco and Oaxaca).
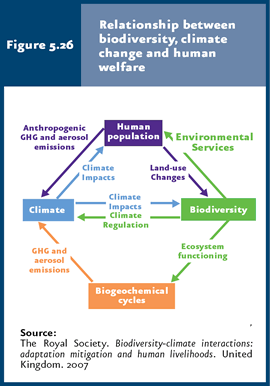
Effects of climate change on biodiversity The socioeconomic development of society is unavoidably linked to the ecosystems’ supply of environmental services and, ultimately, to biodiversity. In turn, however, the balance between supply of environmental services, conservation of ecosystems and biodiversity and the society’s well-being and development all depend on other, no less important, dynamic environmental components, such as the biogeochemical cycles and climate (Figure 5.26). In this sense, the complex network of interactions between them is such that the disruption and/or loss of any of them will lead to negative consequences, frequently hard to predict, on the other components.
As mentioned above, the accumulation of greenhouse gases in the atmosphere, resulting from the intense human activity during the past 250 years – mostly released from fossil-burn burning, agriculture and changes in land use -, has brought about considerable alterations in global climate, which in turn have disrupted biodiversity. This is obvious when considering that climate is one of the major factors globally determining vegetation, structural, floristic and faunistic composition patterns and primary productivity. The effects of climate change on ecosystems add to those derived previously from changes in land use, urbanization and overexploitation of natural resources, among other factors. A substantial amount of studies has been produced which demonstrate the effects of global climate changes on biodiversity and ecosystems (for example, refer to IPCC, 2001). At the ecosystems level, regional climate changes have translated mostly into: i) changes in distribution (boreal forests expanding northwards in the northern hemisphere’s high latitudes), ii) replacement by different ecosystems (wetlands by forests in Alaska), iii) degradation (such as coral reefs worldwide, derived from the rise in sea temperature), and iv) changes in species composition (as seen in forests, alpine communities and coral reefs, among others). These changes add to effects from the increase in the frequency of extreme meteorological events (e. g. hurricanes, drought, floods, hail and wind storms), plus the presence of pests and diseases, on the structure, composition and dynamics of many ecosystems around the world. When these effects are investigated at the species level, evidence reveals alterations in the phenology and morphological, physiological and behavioral patterns of a significant number of species. As regards phenology, modifications have been observed in the timing of reproduction events (such as flowering in plants / spawning and egg-laying or courtship in animals), migrations or decoupling of the life cycles of predators and their preys. Morphologically, disruptions have been observed in the growth patterns of reptiles (The Royal Society, 2007). The consequences of perturbations in biodiversity resulting from climate change could be environmentally significant and lead to serious impacts on human well-being. According to the latest IPCC assessment, if the temperature rises above 1.5 – 2.3ºC in the future, at least 20-30% of the plant and animal species monitored and for which available long-term information exist might be threatened of extinction (IPCC, 2007b; Parmesan & Yohe, 2003). Species extinctions in some animal groups, like amphibians, is already being associated to global climate change (refer to the Biodiversity chapter, Box Global amphibian crisis). Worth mentioning, the loss of species not only means a numeric reduction in the biodiversity of any given country or region, but it jeopardizes the ecosystems’ ability to provide all the environmental services that benefit and sustain human societies. To know how climate change directly affects society, please refer to the Box Social impacts of climate change.
Future climate and its consequences Future global impacts The large amount of factors involved in determining the climate of any given area leads to a certain degree of uncertainty in extrapolations from trends recorded in the past to predict the future climate. Climate projections are carried out through complex numerical models which predict the response under a number of scenarios like, for example, different levels of CO2emissions or changes in vegetation and sea absorption dynamics. Despite the uncertainty involved, the most conservative scenarios predict serious consequences on aspects as relevant to social well-being as human health, ecosystems and water availability; consequently, firm actions have been taken worldwide to avoid any further impacts on the planet’s climate derived from human activities. According to IPCC, CO2 concentration in year 2100 would range between 540 and 970 parts per million (ppm), well above the 280 ppm recorded for the period 1000-1750. Consequently, forecasts for the rise in mean surface sea temperature by the end of this century worldwide range between 1.8 and 4ºC. If the uncertainty associated to the various emissions scenarios modeled is considered, temperature may vary from 1.1 to 6.4ºC. This warming will take place unevenly, that is, it will be more intense in boreal continents and less prominent in the Antarctic and the northern Atlantic oceans. A 0.2ºC temperature rise is foreseen over the next twenty years. Temperature will likely increase more significantly in northern latitudes, leading to a virtually total melting of Arctic sea ice caps by the end of the 21th century. Global projections indicate that, by the late 21th century, the mean sea level will rise between 18 and 59 centimeters as a result of ice melting, although with important regional variations (IPCC, 2007a). The Greenland ice sheet is expected to continue melting, thereby contributing to the rise in sea level, at least until the year 2100 (IPCC, 2007a). Probably, tropical cyclones will also become more intense, carrying more rainfall and stronger winds with them, and heat waves will also occur more frequently. Precipitation will most likely increase at high latitudes but will decrease in subtropical regions in up to 20% towards the year 2100 (IPCC, 2007a). The potential impacts of climate change on biodiversity involve, for instance, the reduction and even loss of natural populations and ecosystems; higher bleaching rates in coral reefs; the reduction or expansion of the distribution areas of invertebrates, fish, insects, birds and plants; earlier flowering in many plant species and the earlier arrival and reproduction of migratory birds. As regards human societies, an increase in the number of deaths may occur worldwide as a result of heat waves, and diseases such as malaria and dengue fever are expected to become a global public-health issue as a consequence of the expansion in the distribution area of vector insects (IPCC, 2001; NAS, 2001; Townsend et al., 2002; CBD, 2003; Smith et al., 2003).
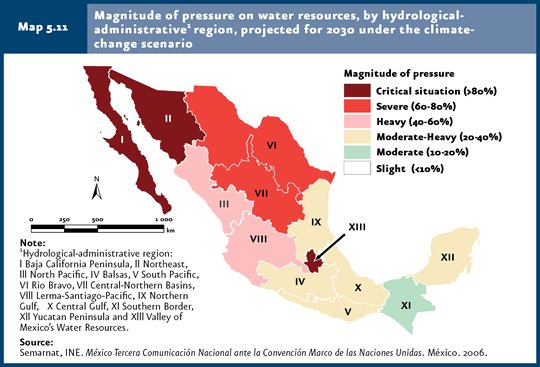
Future impacts in Mexico Likely scenarios have also been proposed for Mexico. According to the Third National Communication to the United Nations Framework Convention on Climate Change, mean temperature in Mexico is estimated to be 2-4°C higher by year 2080 (this rise may even begin occurring since 2050), with the northern region recording the greatest increases. As a result of the temperature rise, a greater number of forest fires is also expected (Semarnat, INE, 2006c). In the Caribbean Sea, Gulf of Mexico and Mexican Pacific Ocean, surface sea temperatures may rise between 1 and 2°C, with the consequent higher probability that tropical cyclones reach a higher category in the Saffir-Simpson scale. As for rainfall, the degree of uncertainty associated with projections is of the same order of magnitude as the projected changes. Some models predict slight increases in En related to rainfall, whereas others have projected drastic decreases. Nevertheless, most models anticipate drops in winter rainfall of up to 15% and 5% in central Mexico and the Gulf zone, respectively. Furthermore, delays in the onset of the rainy season are also anticipated, with an extended season towards the fall in broad parts of the country (Semarnat, INE, 2006c). The number of heavy storms is also expected to increase, in addition to more extreme and prolonged periods of drought. Considering the above together with the projections of socioeconomic variables (e. g. population, gross domestic product, agriculture, etc.) which determine the intensity of water use, it is anticipated that water availability in the years 2020 to 2030 may be 10% below the year 2000 levels. In this scenario, both Baja California and Sonora will face a critical situation in terms of demand of water resources (Map 5.11).
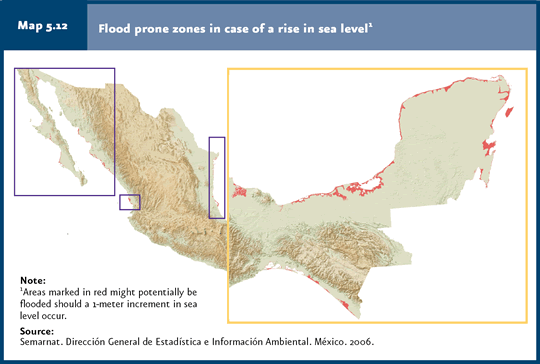
With respect to ecosystems, national projections reveal that the distribution of grasslands, xerophilous shrubland and oak forests will be severely affected, as 53 and 62% of the area of these plant communities will be exposed to different climatic conditions compared to those prevailing today (Semarnat, INE, 2006c). Climate scenarios for the year 2020 point out moderate reductions in the suitability of land for non-irrigation corn crops, and rises of up to 4.2% in the extension of areas unsuitable for this crop. The so-called “canicula” (mid-summer drought) – the season of the year where heat is strongest - will occur more frequently, resulting in negative effects on non-irrigation crops (Semarnat, INE, 2006c). There are a number of coastal areas throughout the country which might be affected if the sea level continues rising (Map 5.12; Semarnat, 2007). According to Magaña and Gay (2002), there are nearly 20 million inhabitants in Mexico living in flood-prone areas, making them especially vulnerable to climate variations and extreme events like hurricanes.
Measures to curb and face climate change The UN Framework Convention on Climate Change (UNFCCC) was created in 1992 in response to this global issue, aiming at achieving a stabilization of GHGs in the atmosphere at levels which minimize anthropogenic interferences in climate. Mexico subscribed and ratified this agreement in 1992 and 1993, respectively (Semarnap, INE, 1999; UNEP, 2002). The Kyoto Protocol was created in 1997 as a UNFCCC instrument, setting forth as a mandatory commitment from developed countries and nations with transition economies (belonging to Annex I) a 5% reduction in GHG emissions – based on the respective 1990 emissions - to be reached between 2008 and 2012. For developing countries, the Protocol set no quantifiable GHG emission-reduction goals, but specific commitments were established, including the elaboration and communication of national GHG emission inventories, as well as studies focused on remediation and adaptation to climate change. Mexico subscribed to this Protocol in 1998 and ratified it in the year 2000 as a Non-Annex I country (developing countries; Semarnap, INE, 1999). As of October 2008, 182 countries had ratified, approved or accepted the Kyoto Protocol, jointly accounting for 63.7% of total GHG emissions released by either developed countries or nations with transition economies (UNFCCC, 2008). Some of the countries with the highest emissions have refused to ratify the Kyoto Protocol, including the U.S., a country that is responsible for 22% of global CO2 emissions, approximately. To note, despite the Protocol was created in 1997, it was until the year 2005 that it entered into force, since it required to be accepted by Annex-I countries who had jointly emitted 55% of GHGs in 1990. This figure was attained at the end of 2004, when Russia, a country responsible for 17.4% of total emissions released by Annex-I countries (it contributes 6% to world emissions), ratified its adhesion to the Protocol. Within the framework of these international agreements, Mexico has promoted various remediation and adaptation measures to face climate change. The country has stood out at an international level for its active participation in tackling this issue, ranking forth in terms of efforts devoted to fight climate change. The current scenario evidences the need for governments to take measures aimed at reducing their GHG emissions and develop adaptation and remediation strategies to face climate change. It is estimated that the risks and costs of the greatest impacts of climate change might be significantly reduced if mankind succeeds in stabilizing atmospheric GHG levels between 450 and 550 ppm of CO2 equivalent (CO2e). Otherwise, if GHG levels exceed 550 ppm of CO2e, the risks and costs may rise exponentially. Achieving stabilization would require a 20-70% reduction in global emissions by the year 2050 compared to current levels (Stern, 2007). According to the Stern Report (Stern review: the economics of climate change), failure to act would translate to total costs of climate change impacts equivalent to 5% of the global annual GDP, currently and from now on. It is worth stressing that if the risks and costs of less optimistic climate change scenarios are considered, the estimated cost may exceed 20% of global GDP. By contrast, if measures are implemented to reduce global GHG emissions, the cost would be around 1% global annual GDP (Stern, 2007). In view of this scenario, Mexico is preparing its own Study on the Economic Implications of Climate Change, which will enable to assess the magnitude of the economic effects of climate change across different sectors.
Notes: 6According to IPCC, “most likely” corresponds to a probability > 90%. 7Factor weight index (CO2 in this case) as a potential climate change mechanism. This refers to the change in net radiative-energy flow towards the Earth surface as a result of changes in internal atmosphere composition, or of changes in external solar energy input. A positive radiative forcing contributes to heat the Earth surface, whereas a negative one promotes cooling. 8CO2 equivalent: carbon dioxide concentration that might cause the same degree of radiative forcing as a given mixture of carbon dioxide and other greenhouse gases. 9Emissions derived before, during and after carbon mining activities, as well as those related to oil and natural gas production, transportation, storage and distribution. 10International agreement seeking to reduce GHG emissions. 11The Saffir-Simpson scale classifies hurricanes according to wind intensity; categories range from 1 to 5. 12Permafrost: permanently frozen soil layer in cold regions. 13According to IPCC, probable refers to a probability > 66%.
|
