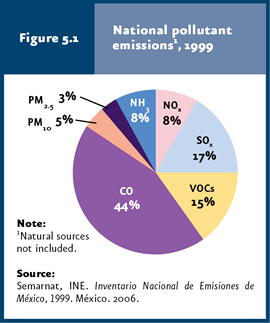
40.5 million tons of pollutants were discharged into the atmosphere in 1999 (58% from natural sources and 42% from anthropogenic sources). |
Anthropogenic sources released mainly CO (44%), SOx (17%) and VOCs (15%). |
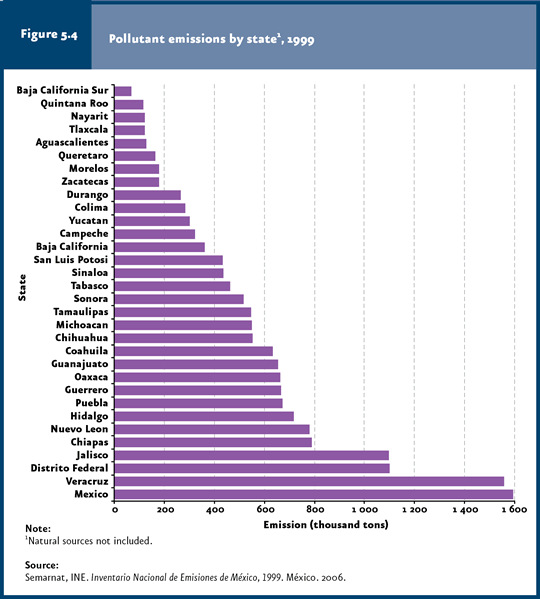
The four States releasing the highest air-pollutant emissions in 1999 were: Mexico, Veracruz, Federal District and Jalisco. |
In 1999, each inhabitant of Mexico produced an average of 170 kilograms of air pollutants. |
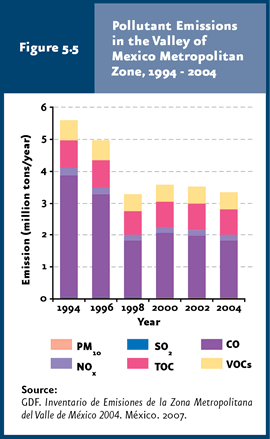
In the VMMZ, CO is the major air pollutant (50% or total emissions); however, the volume released of this pollutant has decreased (1994-2004). |
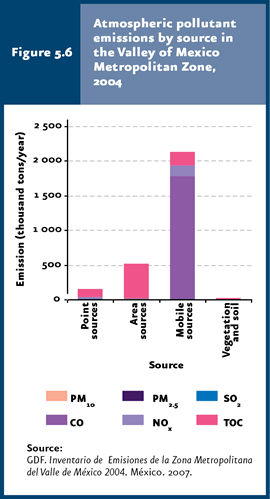
In the year 2004, motor vehicles released the highest amount of air pollutants in the VMMZ (75%). |
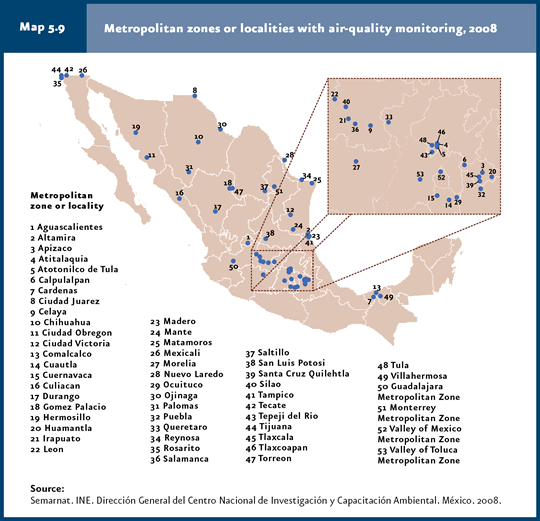
Today, air pollutant records are available for 53 metropolitan zones and locations throughout the country. |
The two major pollutants in Mexico are O3 and PM10, as all cities with available information exceeded the maximum allowable concentrations at least once a year. |
CO, SO2 and NO2 concentrations, as well as the number of days with levels above the standard limits, have both decreased significantly.
|
CHAPTER 5. ATMOSPHERE |
Atmospheric pollution has local, regional and global effects. Since a while ago, Mexico faces air-quality issues in its large metropolitan zones, the Valley of Mexico being the best known and documented case. Air quality is a permanent concern, since the most notorious signs of deterioration, like a lesser visibility and the rise in pollution-related discomfort and diseases, have become chronic in the country’s major cities. In addition to the local effects of poor air quality both on people’s health and on their belongings (e. g. the deterioration of architectonic monuments), also regional effects occur, such as those in forests and aquatic ecosystems caused by acid rain (as in northern Europe in the past and in China today), or even at a global level, as in the case of climate change and the thinning of the stratosphere’s ozone layer, the most evident effects of which have been detected in the Antarctica and other regions of the planet (PNUMA, 2002). Given this scenario, having reliable and updated information on the most relevant topics related to the atmosphere is essential. Specifically, having a diagnosis on the air quality status in Mexico (for the country’s largest cities and urban centers), global climate change and ozone layer thinning, is key. In this context, this chapter includes information on the inventory of pollutant emissions to the atmosphere, the current regulations related to the major pollutants and a description of air quality in Mexico’s largest cities and urban areas over the past years. Furthermore, recently gathered information on the global climate change and ozone layer thinning is also included, considering both actions taken by Mexico to this respect and the likely consequences of this phenomenon in the national territory.
AIR QUALITY An adequate air-quality management requires information on both the current air quality status and the main pollutant sources, to lie the grounds for programs aimed at improving air quality. Such data derive mainly from inventories and monitoring networks.
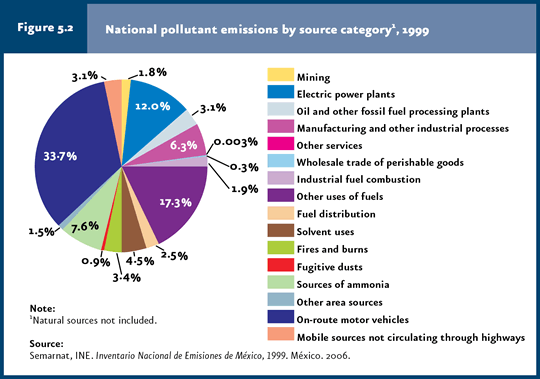
Emissions inventories In any given area, air quality is not only affected by climatic and geographic factors but is also directly related to the volume and characteristics of pollutants emitted to the atmosphere, both locally and regionally. Thus, an essential component in the design and implementation of any air-pollution control program lies in the information on the major atmospheric pollutant sources and the quantities emitted. Background information on emissions inventories in Mexico dates back to 1988, when the National Inventory System of Emissions from Fixed Sources was implemented, as well as the investigation aimed at quantifying emissions in the Valley of Mexico Metropolitan Zone (VMMZ). A program to improve Mexico’s capability to elaborate emissions inventories was launched in 1995 and broadened in 2001, focused on the development of a National Inventory of Emissions in Mexico (INEM in Spanish). This development comprised three phases: I) planning, II) inventory development for six northern states, and III) an inventory for the remaining states. The results of the second phase were published in 2005 along with the data of the 1999 Inventory of Emissions for the Northern Border States of Mexico, which included information on emissions for Baja California, Coahuila, Chihuahua, Nuevo Leon, Sonora and Tamaulipas (Semarnat, 2005; Semarnat, INE, 2005). The INEM was finally published in 2005, including the 1999 information broken down by emission source and for all the country’s states and municipalities (Semarnat, INE, 2006b). Although this chapter will focus primarily on INEM’s results, there are earlier local inventories which started to be developed in the 1990s and that contribute valuable information on some Mexico’s cities and metropolitan zones (refer to Box Local emissions inventories). According to the National Inventory (INEM), 40.5 million tons of pollutants were discharged into the atmosphere in 1999, 58% from natural sources – that is, soil, vegetation and volcanoes – and 42% from anthropogenic sources. Vegetation released volatile organic compounds (VOCs), whereas soil produced nitrogen oxides and volcanic activity injected sulfur dioxide and particles. Although emissions from natural sources were greater than anthropogenic ones, the latter are relevant because these are generated in or near cities and towns, so that the number of persons exposed to the negative effects of pollutants increases. INEM points out that natural sources are likely overestimated, as the data used to calculate emissions from vegetation and soil – land-use, vegetation cover and temperature data – involve some uncertainty. Methods to estimate volcanic emissions, as well as their fluctuations, lead to considerable errors in emission estimates (Semarnat-INE, 2006b). Considering only anthropogenic sources, the major air pollutants were carbon moNOxide (CO; 7.5 million tons; 44% of total emissions), sulfur oxides (SOx; 2.9 million tons; 17%) and volatile organic compounds (VOCs; 2.6 million tons; 15; Figure 5.1). Most emissions were produced by motor vehicles (33.7% of total), other fuel uses1 (17.3%) and electric power plants (12%; Figure 5.2, IB 1.1-2).
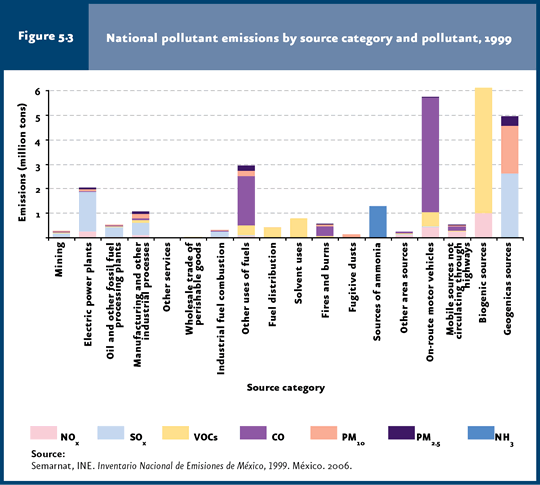
Motor cars released mostly CO (62% of the total amount released by all sources), nitrogen oxides (NOx; 31%) and VOCs (22%; Figure 5.3; IB 1.1-2). Electric power plants released the highest amounts of SOx produced at a national level from anthropogenic sources (56%), as well as an important amount of NOx (18%). The “other fuel uses” category contributed large amounts of particles smaller than 2.5 µm (PM2.5; 38%), particles smaller than 10 µm (PM10; 29%), CO2 (27%) and VOCs (16%). As for ammonia (NH3), cattle-raising, fertilizer application and domestic sources accounted for virtually all air emissions (99%).
Per State, pollutant generation (Figure 5.4) was highest in the State of Mexico, Veracruz and Jalisco, as well as in the Federal District (with emissions released mostly from transportation; in Veracruz and Jalisco these came mostly from transportation, household wood burning and electric power plants). Each State produced between 6.4 and 9.4% of total national anthropogenic emissions. By contrast, Southern Baja California, Quintana Roo, Nayarit, Tlaxcala and Aguascalientes each released less than 1% of the national total.
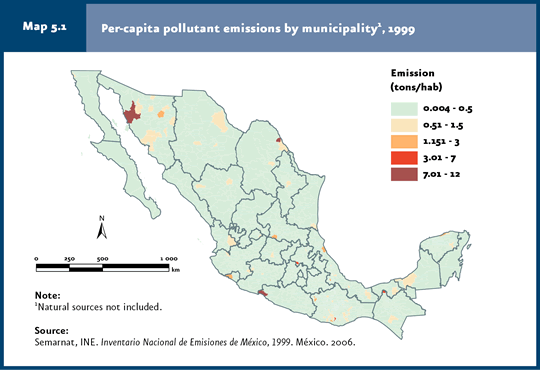
When pollutant emissions are analyzed on a per-capita basis by municipality and district, it turns out that 93% of these areas discharged from 0.004 to 0.3 tons2. The three municipalities reporting the highest per-capita emissions were: Nava (Coahuila), Pitiquito (Sonora) and La Union de Isidoro Montes de Oca (Guerrero), with 11.9, 8.9 and 8.2 tons per capita, respectively (Map 5.1). The remaining municipalities report per-capita emissions below 5 tons. When total pollutants emitted in 1999 and the total population are considered, each person contributed some 0.17 tons to air pollution, on average.
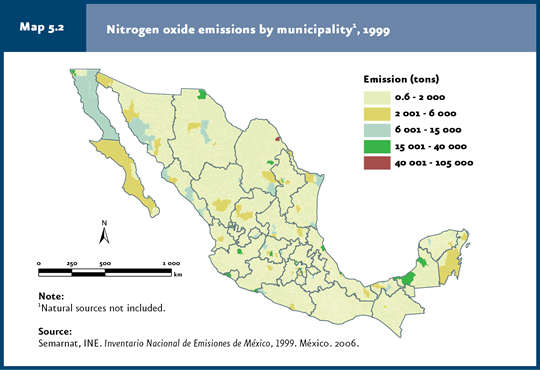
If the air pollutant information is examined by municipality and pollutant, about 95% of the country’s municipalities released from 0.6 to 2000 tons of NOx, accumulating a little over 429 thousand tons which represent 30% of total NOX emissions at a national level (Map 5.2). If the emissions from the municipalities producing until 15 thousands tons are added the value is about 68.7% of the national figure. The Nava municipality, in Coahuila, is worth mentioning, since it released about 7% of total NOX emissions, almost totally from fixed sources3, mostly from electric power plants.
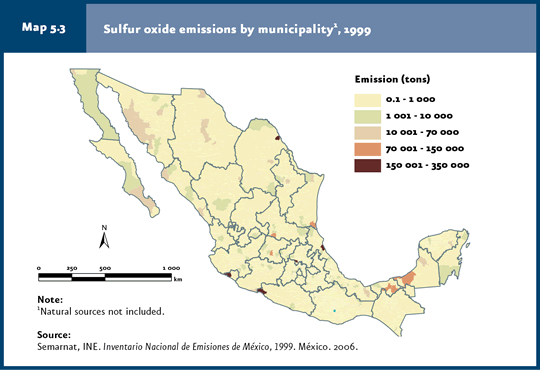
As for national SOx emissions, 38% concentrated in five municipalities: Tula de Allende (Hidalgo), Tuxpan (Veracruz), Manzanillo (Colima), La Union de Isidoro Montes de Oca (Guerrero) and Nava (Coahuila). In all cases, most emissions derived from fixed sources, particularly electric power plants and oil refineries (Map 5.3). The majority of the country’s municipalities (95%) released between 0.1 and one thousand tons of SOx, representing a mere 3.4% of total emissions.
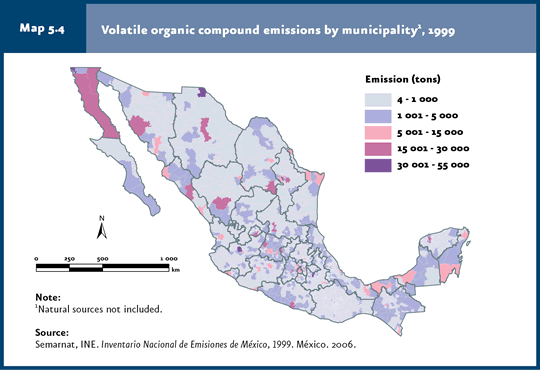
Separately, released VOCs ranged from four to one thousand tons in 83% of the municipalities (Map 5.4). The four municipalities and districts releasing the highest VOC emissions were: Guadalajara (Jalisco), Juarez (Chihuahua), Tijuana (Baja California) and Ecatepec de Morelos (Mexico), as well as the Iztapalapa district, Federal District. These municipalities and district released a little over 222 thousand tons of VOCs (equivalent to 8.6% of total VOC emissions), mostly from area sources4 and motor vehicles.
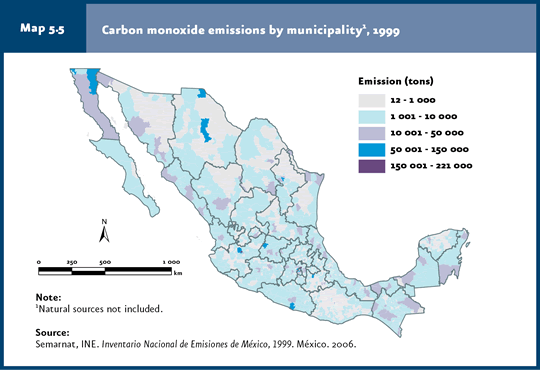
CO was released primarily by municipalities belonging to large cities with high numbers of motor vehicles. The most important municipalities to this respect were: Guadalajara (Jalisco), Ecatepec de Morelos (Mexico), Monterrey (Nuevo Leon) and Zapopan (Jalisco), as well as the Iztapalapa district (Federal District; Map 5.5).
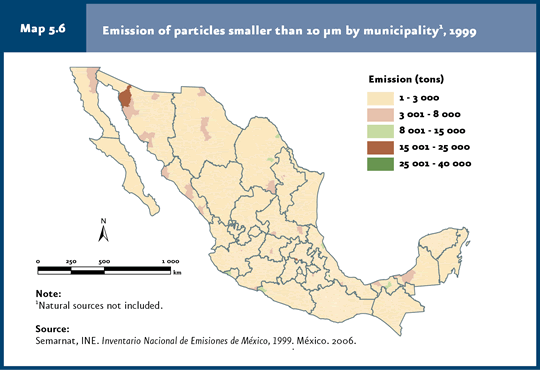
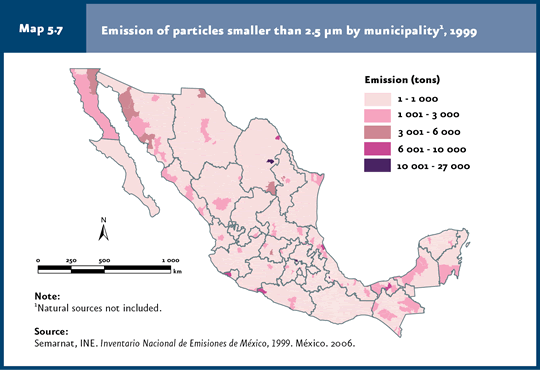
As regards PM10, virtually all the country’s municipalities (98.6%) released between one and three thousand tons, accumulating 71% of total PM10 emissions (Map 5.6). This is also observed in the case of PM2.5 emissions, with most municipalities (96%) producing from one to three tons, which jointly represent 56% of total emissions (Map 5.7). Both types of particles were released mostly from fixed and area sources located in these municipalities.
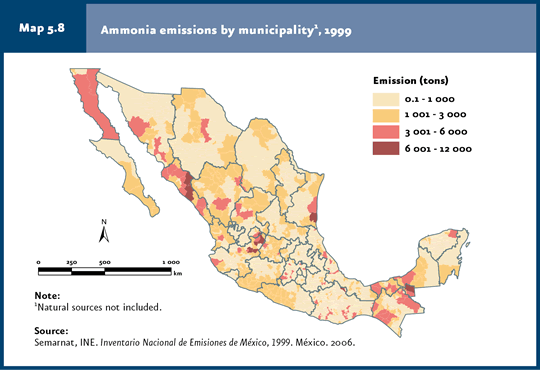
In relation to ammonia (NH3), released primarily from cattle-raising practices, 97% of municipalities produced between 0.1 and 3 thousand tons, concentrating a total of 962 thousand 386 tons (accounting for 73.7% of total NH3 emissions; Map 5.8).
Emissions from the Valley of Mexico Metropolitan Zone (VMMZ) Pollutant emissions for VMMZ have been estimated for two-year intervals between 1994 and 2004, allowing a description of the evolution of emissions during this period. The results highlighted in this section correspond to 2004, considering 1994 as baseline for the analysis of changes. The information used for the present analysis was published in the 2004 VMMZ emissions inventory, which includes back-calculations for all previous years using the same methodology. Considering total pollutants released between 1994 and 2004, there was a significant drop between 1994 and 1998, followed by less evident changes thereafter (Figure 5.5). CO has consistently been the major air pollutant, representing more than 50% of total emissions. Nevertheless, this gas has underwent the most drastic drop in volume of emissions, from 3.8 million tons in 1994 to 1.8 million tons in 2004, suggesting that this pollutant is indicative of the trend in total emissions.
As regards pollutant sources, in 2004 motor vehicles accounted for the highest emissions (75%) (Figure 5.6), CO being the major pollutant (83%). High emissions linked to mobile sources may be due to a number of factors, such as the rise in the number of circulating vehicles, the amount of fuel consumed by these and the low proportion of vehicles including pollution-control technologies (for example, in 2004 26% of motor vehicles still lacked emission-control systems).
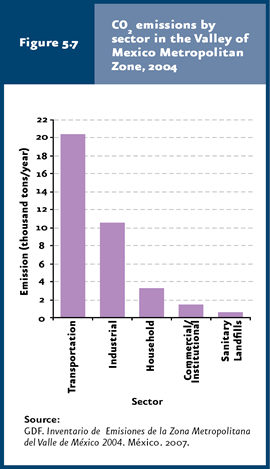
Second in importance to mobile sources are area sources, accountable for 18.4% of total air emissions. Point sources, vegetation and soil jointly contributed 6.1% of emissions. The VMMZ emissions inventory also includes the volume of greenhouse gases produced by transportation, industries, households and commerces/institutions, estimated using the methodology proposed by the Intergovernmental Panel on Climate Change (IPCC). Furthermore, the inventory considers CO2 derived from urban solid waste degradation in sanitary landfills. According to this inventory, total CO2 emissions for VMMZ in 2004 rose to 35.8 million tons, 98% (35.2 million tons) derived from fossil fuel combustion by the four sectors considered and some 2% (600 thousand tons) from urban solid waste degradation in sanitary landfills. According to this inventory, transportation is the primary CO2 producer (57% of total), mostly due to gasoline consumption; industry accounts for 30% of emissions, derived primarily from natural gas combustion (26%); households and commerces/institutions released the remaining 13% (Figure 5.7; GDF, 2006b).
Additionally, 235 thousand 65 tons of methane (CH4) were released to the atmosphere; to note, this volume is included within the emissions of total organic compounds (TOCs) mentioned above. About 95% (223 thousand 346 tons) of methane was produced in VMMZ sanitary landfills.
Air Quality Regulations and Monitoring Air pollutants cause negative effects on human health, including respiratory diseases and cardiovascular disorders. For this reason, the atmospheric concentration of the major pollutants - SO2, CO, nitrogen dioxide (NO2), ozone (O3), PM10, PM2.5, total suspended particles (TSP) and lead (Pb) - are monitored in Mexico. An air-quality standard has been established for each, setting forth the upper limits that shall not be exceeded in any given period of time, aimed at guaranteeing proper protection of human health, including that of the groups most at risk (Cuadro D3_R_AIRE01_03). The air-quality standards currently in force were published by the Board of Health in the Federation Official Gazette in December 1994; a modification to the Ozone Standard was published in October 2002 (DOF, 2002) and the Particulates Standard was modified in September 2005, including PM2.5 for the first time (DOF, 2005). Separately, Semarnat is entitled to issue the Mexican Official Standards which set forth the procedures to measure and calibrate the equipment used for determining pollutant concentrations, maximum allowable levels for pollutant emissions and specifications of fuels used (Cuadro D3_R_AIRE01_03). The limits set forth in the standards must be based on epidemiological, toxicological and exposure assessment identifying the pollutant levels likely to cause a negative effect on health with a given safety margin. However, mainly due to the lack of resources to conduct these studies as well as to the severity of the air-pollution issue in the early 1990s, the Mexican air quality standards were based on the revision of Standards issued by the World Health Organization and the US EPA, rather than on specific studies for the Mexican population. Air monitoring stations and networks have been set to determine pollutant concentrations. Today, air pollutant records are available for 53 metropolitan areas and locations (Map 5.9; Cuadro D3_AIRE01_02; IB 1.1-8; IC 7). In all of them, pollutants are measured using internationally standardized procedures. The oldest and most complete network is located in the VMMZ, including 36 automated and 13 manual monitoring stations, which record O3, CO, SO2, NO2, PM10 and PST concentrations, among others, considered as criteria pollutants and for which there is comprehensive information on their effects on human health. Since lead concentration in VMMZ has significantly decreased and is deemed under control, it is not included in the present report.
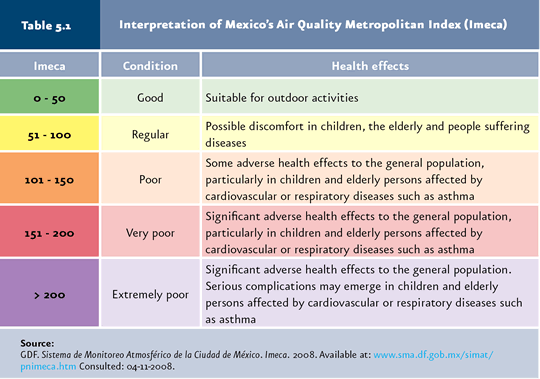
Other cities having important monitoring networks and relatively “old” records (from the mid 1990s) are the metropolitan zones of Guadalajara, Monterrey, Toluca and border cities like Tijuana, Mexicali and Ciudad Juarez. Some cities focus on assessing one or several locally important pollutants, as is the case of most cities in the state of Hidalgo, Ciudad Obregon and Naco in Sonora, all of which specifically determine particulates, whereas Matamoros records SO2 y PM10, only to mention some examples. For the complete list of monitoring stations and the respective pollutants recorded in each, please refer to Cuadro D3_AIRE01_02. In order to make air pollution levels easier to understand, Mexico has implemented the use of the so-called Imeca Index (Metropolitan Air Quality Index), consisting in a transformation of pollutant concentrations into an adimensional figure. In the Imeca’s scale, levels are categorized in multiples of 50 Imeca (Cuadro D3_R_AIRE01_04). Communication to the public on the Imeca system started in 1986 through several means, and today this information is broadcasted through the radio, press, TV and the Internet. However, since no official document was available defining the meaning and usefulness of Imeca, as well as on guidelines for calculation, use and communication, a lack of harmonization of procedures between the different bodies issuing Imeca data was evident. This led to the development of the Environmental Standard NADF-009-AIRE-2006 by the Federal District government (GDF,2006a), which sets forth the provisions that Imeca shall meet. This Standard is mandatory in the Federal District and the State of Mexico suburban municipalities adjacent to the VMMZ. In this respect, Imeca aims to provide clear, timely and ongoing information to the general population on air pollutant levels, the likely health effects and the protection measures to be implemented. In this new regulation, Imeca status is made known using colors and qualifiers about air quality according to the extent of the risk for human health (Table 5.1). Imeca represents a valuable tool for the immediate assessment of occurrence of air-pollution events and facilitate communication on this aspect to the general population. However, for analyzing the historical behavior of air quality or compliance with air-quality standards in any given region, it is preferable to use indicators derived from databases validated by air monitoring networks and applying the same criteria during data processing (INE, 2007).
Based on Imeca figures, local authorities may issue an environmental contingency alert, which refers to an occasional and transient situation in which air pollutants reach potentially hazardous levels for the general population. Some of the cities and industrial areas having environmental air-pollution contingency programs are the VMMZ, Guadalajara, Monterrey and Salamanca. The latest environmental contingency alerts were issued in the VMMZ in the year 2002, associated to ozone levels, and in 2005 in relation to PM10. In the Valley of Mexico, some actions taken during a contingency include the suspension of outdoor sports, social and leisure activities, outdoor burning, road-repairing and painting activities, restrictions in vehicle circulation besides to the “Not-circulating-today” program and restrictions in industrial activities, among others.
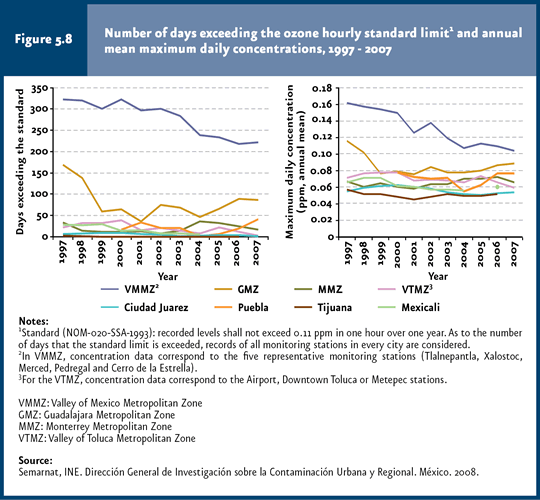
Air quality in Mexican cities There are various ways for analyzing air quality. This chapter focuses on the main cities that have reliable information to allow a proper analysis. To this end, the number of days per year with levels exceeding the Standard for each pollutant was used. This information is supplemented with the trends in mean annual PM10, SO2, O3, NO2 y CO concentrations5. The number of days surpassing the Standard limits reflect the extent of the problem, given that it shows the frequency with which the threshold set forth to protect human health is exceeded; furthermore, this information plus the trends in annual concentration averages enables to get an insight on the temporal fluctuations in air quality and is a means for assessing the effectiveness of the measures taken to control air pollution. When examining the frequency with which limits set forth in Standards are exceeded, it is evident that the two major pollutants at a country level are O3 (Figure 5.8;IB 1.1-7) and PM10 (Figure 5.9; IB 1.1-5), since all cities exceeded the respective maximum allowable concentrations at least once a year. O3 is the main pollutant in the VMMZ, given that the number of days exceeding the Standard (0.11 ppm) is still high (222 days in 2007, accounting for 61% of the year); to note, though, this figure is significantly lower today relative to levels recorded in the late 1990s, when these hovered around 86%. In the Guadalajara Metropolitan Zone (GMZ), the frequency of O3 levels exceeding the Standard dropped from 169 days in 1997 to 87 days in 2007. All other cities displayed frequencies below 41 days in 2007. Both VMMZ and GMZ show an evident decreasing trend in annual daily O3 concentration averages, although the GMZ underwent a rise from 2004. In the remaining cities, pollutant concentrations remain relatively unchanged, with slight variations (Figure 5.8;IB 1.1-7).
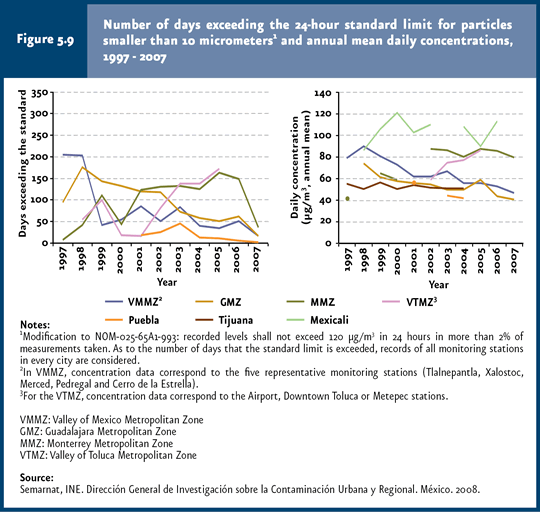
In the case of PM10, the VMMZ is no longer the area most frequently exceeding the limit for daily emissions (120 µg/m3, 24 hours) set forth in the Standard, as the occurrence dropped from 206 days (56%) in 1997 to just 17 days (5%) in 2007. By contrast, in 2005 the Valley of Toluca Metropolitan Zone (VTMZ) exceeded the corresponding Standard in 173 days (47%), showing a rising trend in the number of days above the standard limit (Figure 5.9;IB 1.1-5). The Guadalajara Metropolitan Zone displays a decreasing trend, with 17 days above the standard in 2007. Annual mean daily concentrations also decreased: from 1999, the VMMZ reports concentrations below those detected in the Monterrey Metropolitan Zone (MMZ), and even lower than those recorded in VTMZ and Mexicali for several years. A rise is observed in both VTMZ and MMZ, as opposed to the decrease in GMZ from 1999. On the other hand, Puebla displays levels below the figures reported in the cities mentioned above (Figure 5.9;IB 1.1-5).
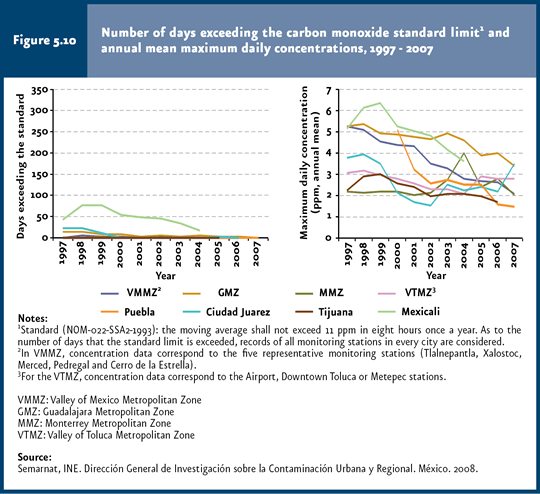
CO pollution is not an issue nowadays, despite high emission levels (Refer to the Box Local emissions inventories), since no city reported days above the Standard in 2007 (Figure 5.10;IB 1.1-3). Annual mean daily concentrations for CO have dropped in the past years in most cities with available information.
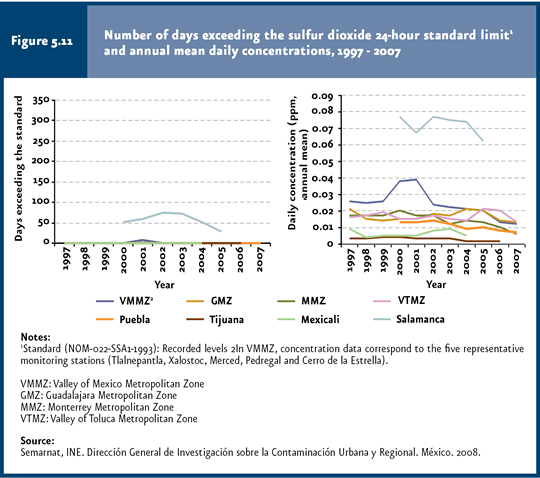
SO2 also seems to be controlled in nearly all cities where it is measured; from 2003 to date, no city recorded days above the Standard limit, except for the MMZ and Salamanca, which in 2005 reported 1 and 29 days, respectively (Figure 5.11; IB 1.1-6). All cities display relatively low daily concentrations; only Salamanca reports high levels.
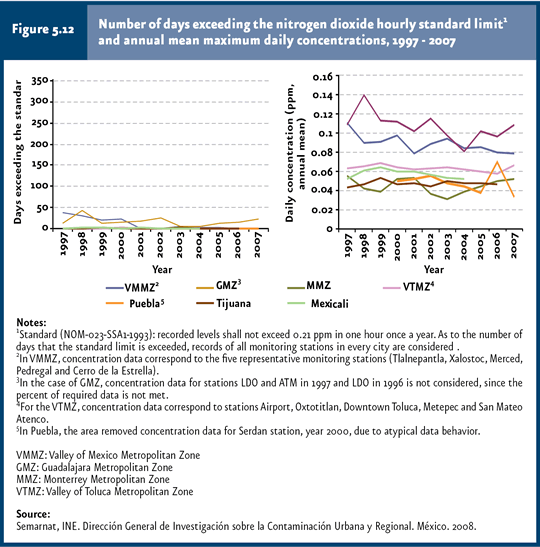
The NO2 pollution issue has undergone a considerable decrease; in 2007 only the GMZ exceeded the standard limit for 23 days (Figure 5.12; IB 1.1-4). Likewise, NO2 concentration shows a decreasing trend since the late 1990s in VMMZ and ZMG, whereas the remaining cities maintain relatively constant levels, although always below those in the Valley of Mexico and Guadalajara.
Although today there are monitoring stations gathering data for the major pollutants in other cities, these are insufficient to reflect a national cover and, in some cases, the information still lacks the characteristics required to allow a reliable analysis. In the case of acid-rain monitoring, no data are yet available at a national level to assess the current status; however, the VMMZ already has a monitoring network including historical data (Refer to Box Acid rain: causes and consequences). The trend analysis for the major pollutants suggests that, in general, air quality has improved in the largest cities. Although air quality is still deficient in the VMMZ, specifically due to O3 levels, it is worth stressing the fact that there is a decreasing trend in both pollutant concentration and the number of days exceeding the Standard limits. Undoubtedly, lead removal from gasoline, the reduction in sulfur content in both gasoline and diesel, the market launch of oxygenated and reformulated gasoline, the setting forth of more strict emission limits for new vehicles and the adoption of increasingly more efficient motor-vehicle technologies have all significantly contributed to avoid lead from being an air-pollution issue, and to attain SO2, CO and NO2 levels that rarely exceed the Standard limits. As a response to the air-pollution issue, the federal government – in coordination with state and municipal authorities and with the participation of the academia – has set forth programs aimed at improving air quality, known as Proaires. These programs represent one of the main instruments developed to reverse the deterioration trends. Additionally, these incorporate mid- and long-term visions, and propose concrete actions for reducing and controlling emissions (Semarnap-INE, 2000; Semarnat, 2003). Proaires have been applied in those metropolitan zones which, due to their features - including number of inhabitants, industrial activities, number of motor cars and climatic and geographical conditions, among others - display the most severe air pollution issues. The metropolitan areas for which at least one Proaire program has been developed are the Valley of Mexico, Monterrey, Guadalajara, Toluca, Ciudad Juarez, Mexicali, Tijuana-Rosarito, Salamanca, Michoacan, Puebla and Leon. In all cases, the program development was based on air-quality and emission-source information. Actions established in Proaire programs are oriented towards those sources with the highest pollutant emissions, and include feasible reduction measures in terms of cost, with a significant improvement in air quality. The Standard NOM-086-SEMARNAT-SENER-SCFI-2005 was published in January 2006 as part of the measures for controlling the air-pollution issue, setting forth new specifications for fuels sold in Mexico, mainly in terms of sulfur, olefin and benzene content. The Magna gasoline was launched to the market in January 2005, with a sulfur content of 300 parts per million (ppm) (500 ppm max); the Premium UBA (ultra-low sulfur) gasoline was launched in October 2006, with 80 ppm maximum, for use throughout the country. Furthermore, the UBA diesel (15 ppm max) was introduced to the market across the northern border in early 2007; this is planned for distribution in the VMMZ, GMZ and MMZ in 2009, followed by expansion to the whole Mexican territory. Other actions implemented at a local level, such as reforestation and paving, credits to renew motor vehicles and a better control of emissions from fixed sources have also been important. Nevertheless, a greater investment for controlling and bringing down air pollution is required. Public expenses allocated to air-pollution prevention and control in 2004, as reported by INEGI, amounted to 198 thousand 910 million pesos, representing a mere 0.5% of total environmental expenses, which also include projects related to wastewater, solid wastes, soil and groundwater, biodiversity and landscape, ecological regulation and conservation programs, ecological infrastructure, human regulation of facilities and environmental education, among others (INEGI, 2007).
Notes: 1Other fuel uses include household combustion, agricultural combustion and LPG used in transportation; domestic natural and clear gas combustion; farming clear gas combustion and wood burning. 2Per-capita emissions were calculated based on INEM data for 1999 and municipal population data for the year 2000. 3Fixed sources: mining, electric power plants, oil refineries and other fossil fuel procession plants, manufacturing industry, unprocessed food retailers and other services (schools, hospitals, laundry and dry-cleaning services, among others). 4Area sources: industrial fuel combustion, other fuel uses, fuel distribution, solvent uses, fires and burns, fugitive dust, ammonia sources and other area sources (trains, planes, bakeries, wastewater treatment plants, among others). 524-hour averages for PM10 and SO2; maximum daily concentrations for O3 and NO2 and maximum daily concentrations of 8-hour moving averages for CO. |
