| Over the past two centuries, human impact on ecosystems have reached such levels that the ecosystems’ structure and functioning have been severely disrupted.. |
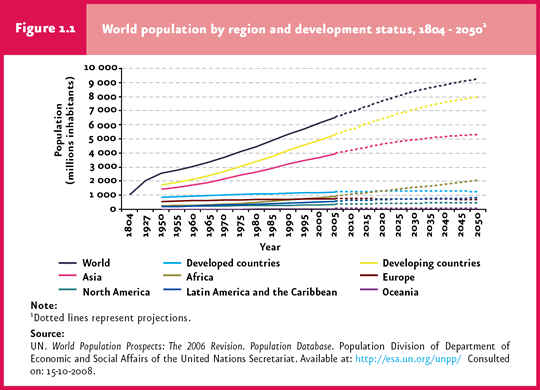
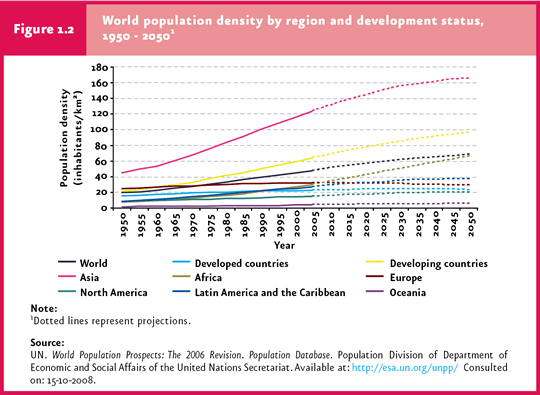
The world population is estimated to reach 9 thousand million people by the year 2050, with a population density of 68 inhabitants per square kilometer. |
In mid-2006 Mexico’s population was 104.9 million inhabitants, with 50.7 % women and 49.3 % men. |
In 2005, there were nearly 185 thousand rural localities and 363 urban zones in Mexico, as follows: 273 small cities, 81 medium-sized cities and 9 large metropolitan areas. |
| CHAPTER 1. POPULATION AND ENVIRONMENT |
Throughout history, man has directly or indirectly depended on nature to meet all his basic needs for food, clothing and housing. Consequently, water consumption, plants, animals and other services obtained from nature, as well as the disposal of wastes derived from various activities have all impacted natural ecosystems. Over the past two centuries these impacts have reached such levels that have translated into significant changes in the structure and functioning of ecosystems worldwide. Unlike many other issues that societies currently face, the impact of environmental issues surpasses the political or administrative boundaries of countries or regions; hence, local, regional and multinational actions are required to address them. One example is global warming, caused primarily by greenhouse gas emissions in both industrialized and developing countries, the negative effects of which are evident throughout the world. Population welfare relies to a great extent on environmental services which only healthy ecosystems can provide, including food, energy, genetic resources, flood control, soil formation, disease control, climate control and waste breakdown. Thus, ecosystem preservation is a concern that goes beyond a strictly environmental scope and is being included in the social, economic and health agendas of governments around the world (refer to Box Ecosystems’ environmental services and human welfare). The importance of including the population subject in an environmental report lies in that a number of factors leading to environmental stress and the potential solutions to environmental deterioration, as well as the possibility of achieving a sustainable natural resource use, depend on the socioeconomic characteristics of the population living in a particular area. Furthermore, from a sustainable-development perspective, nature conservation requires to include man as one of the system’s component. In this context, this chapter aims to highlight some of the key population characteristics directly related to the environment, rather than focusing on a simple description of the Mexican population1.
POPULATION World Population Modern man has inhabited the Earth for several thousand years, although at low population numbers until relatively recent times. Several thousand years passed before the population reached a thousand million inhabitants - in 1804. However, it took a mere 123 years since then for the population to reach 2 thousand million people in 1927. By 1972, only 45 years later, the world population had doubled again, primarily as a result of the drop in mortality rate when vaccines, antibiotics and insecticides were introduced in the mid 1950s. This growth trend remained constant, and by the late 20th century the Earth’s population had already surpassed 6 thousand million inhabitants. The United Nations Population Division (UN, 2008) foresees that the world population will continue to expand up to 9 thousand million persons by the year 2050 (Figure 1.1). Of course, this population boom has resulted in higher population densities and a heavier land use, leading to an ever-increasing stress on natural ecosystems. In 1950, the average world population density was 19 inhabitants per square kilometer; by the year 2000 it reached 45 inhabitants per square kilometer, and by the year 2050 it is expected to be in the order of 68 inhabitants per square kilometer (Figure 1.2).
In 2005, most of the world population (81.3%) concentrated in developing countries, which also displayed the world’s highest fertility rates (2.8 children per female compared with 1.6 in developed countries), as well as the highest population density (64 inhabitants per square kilometer). For year 2050, the population size in these countries is expected to reach about 8 thousand million inhabitants (86.5 % of the world population). Population growth leads to a higher demand for basic resources such as food, water and raw materials, thus straining severely the natural availability of these resources and deteriorating the environment in areas where these are extracted. For example, meat production needed to meet the demand in developing countries rose from 27 to 147 million tons between 1970 and 2005 (FAO, 2007). This rise involved the destruction of extensive forest areas and their conversion into grazing and cattle-raising land.
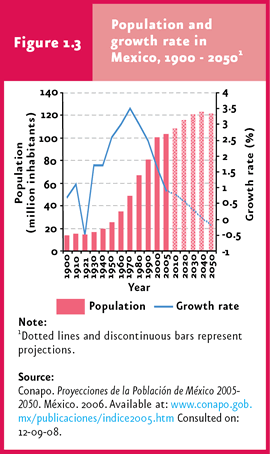
Mexico’s Population Mexico has also shared both the global trend in population growth and the environmental impacts derived from it. Mexico entered the 21st century with a natural growth rate similar to the one observed 70 years earlier, although with a population size seven times as high. In mid-2006 Mexico’s population was 104.9 million inhabitants, 50.7 % women and 49.3 % men. According to national population growth indicators, Mexico is undergoing an advanced demographic transition phase2. The National Population Council (Consejo Nacional de Población) forecast for 2005-2050 (CONAPO, 2006a) predicts that the population will continue growing up to 108.4 million and 120.9 million persons by 2010 and 2030, respectively. According to these estimates, it will be until the year 2042 that Mexico’s population will start decreasing for the first time since the end of the Mexican Revolution (1921) (Figure 1.3).
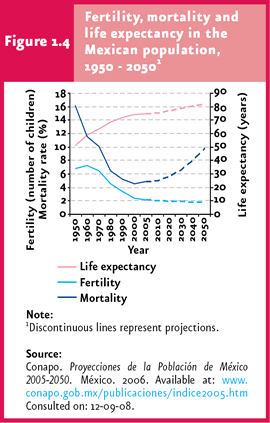
The estimated decrease in Mexico’s population is attributed to a number of factors, the most important of which is the steady drop in fecundity, which was first recorded over 30 years ago. During the 1970s, the average number of children per female was 6.4; in 2005, it was only 2.2. Another factor is the gradual increase in mortality rate observed from the early years of the 21st century, which is expected to rise from 5 % in 2010 to 6.8 % by 2050. Population growth stems from progress in public health, which has led to a rise in life expectancy from 74.6 years in 2005 (72.2 years in men and 77 years in women) to 78.8 years in 2030 (76.6 and 81 years, respectively; Figure 1.4).
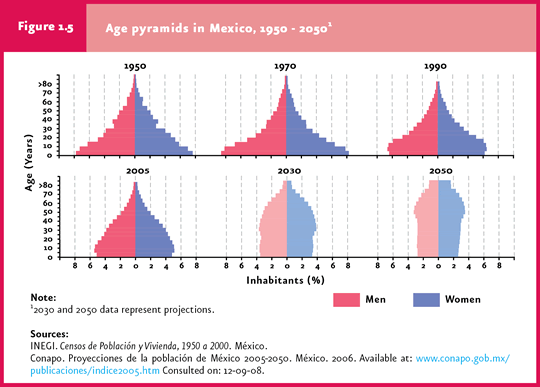
The demographic transition currently taking place in Mexico involves changes in both population structure and composition. The proportion of children has been dropping steadily, whereas the young and elderly are on the rise. Estimates suggest that the relative proportion of pre-school children (0 to 5 years) will decrease from 12.2 % in 2005 to 8.2 % in 2030 and 6.6 % in 2050. On the other hand, population of productive age (15 to 65 years old) and adults older than 65 years will account for an increasingly higher percentage of the population. With an aging population, the mean population age - which was 28 years in 2005 - will be 36.7 years by 2030 and 42.7 in 2050 (Figure 1.5).
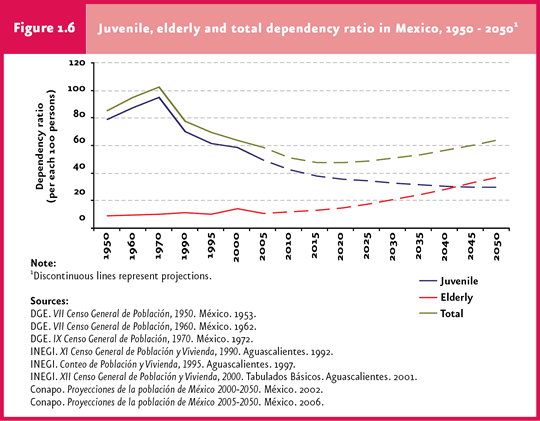
The current demographic transition is leading to a positive relationship between the dependent (children and the elderly) and the productive groups. This relationship has been measured through the dependency ratio3, which reveals that in the years to come there will be less dependent and more potentially productive people. As an example, in 1950 83 dependent persons were supported by 100 persons of productive age; by the year 1970, the number of persons of nonproductive age (PNA) was 108 per 100 of persons of productive age (PPA). However, a decrease in fecundity caused a reversed trend in the dependency ratio, dropping to 78 and 61.3 PNA per 100 PPA in 1990 and 2000, respectively. This shift is called a “demographic bonus”, because it is the moment in the demographic predictions of any given country in which the number of PPA peaks. This bonus will remain until around the mid-21st century, reaching its most advantageous condition around 2020. Thereafter, the dependency ratio will rise due to a growing number of elderly, nonproductive population (Figura 1.6).
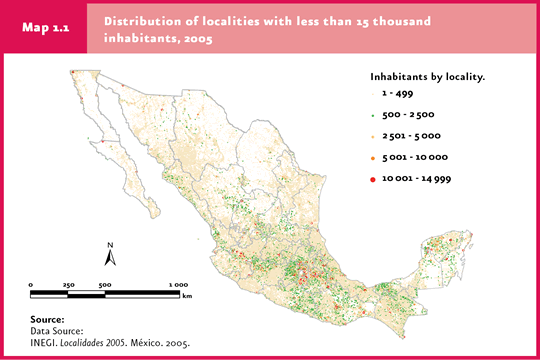
The numerical changes in the Mexican population have paralleled changes in its geographical distribution. The current trend is an accelerated urbanization at the expense of the deterioration of local ecosystems. By the year 1900, nearly 75 % of the population lived in rural localities4 scattered across the whole Mexican territory; in 2005 only 23.5% remained within this category and, today, two-thirds of the country’s population concentrate in a hundred cities. Nearly 185 thousand rural localities were recorded in 2005, being home to 24.58 million people: 43% were located adjacent to highways, 25% in the vicinity of large urban centers and the rest (32%) away from cities and transitable roads (Map 1.1). The isolation of the latter restrains both economic development and the supply of basic health and education, drinking water, sanitation, electricity and telephone services, all of which are directly related to the high levels of marginalization and vulnerability that prevail in these communities.
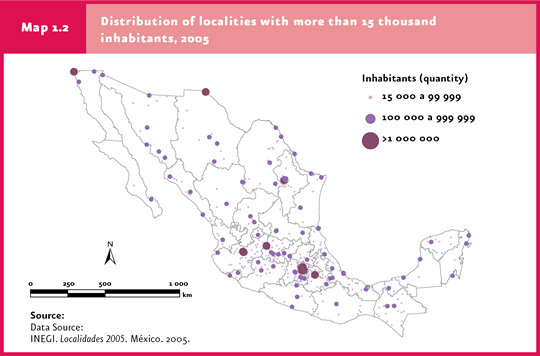
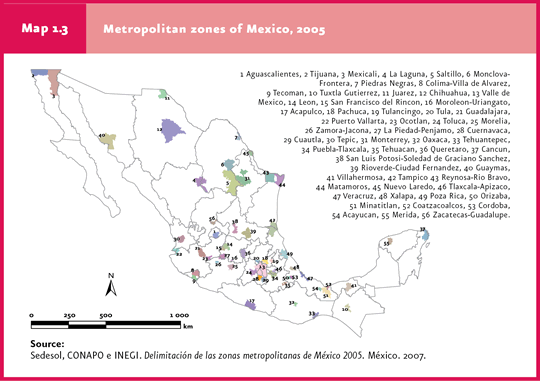
In 2005, Mexico had 363 cities, organized as follows: 273 small cities including 15 thousand to 100 thousand inhabitants (< 9% of the country’s total population), 81 medium-sized cities with a population between 100 thousand and one million inhabitants (nearly 27% of the population) and nine large metropolitan areas with more than one million inhabitants (about 35% of the country’s population; 36.1 million). Among the latter, the most important are the Metropolitan Zones of the Valley of Mexico (VMMZ), Guadalajara and Monterrey (19.2, 4.1 and 3.7 million inhabitants, respectively; Maps 1.2 and 1.3).
The excessive population concentration in urban zones, with the associated economic and labor needs, frequently leads to negative environmental consequences that stretch beyond geographical and political borders. For instance, acid rain precursors (NOx y SO2) released from northern VMMZ industrial zones are transported by the wind, resulting in the most acid pluvial precipitation in farming areas and forests located south and west of the Valley of Mexico (Velasco-Saldaña et al., 2002). Yet another consequence of the heterogeneous distribution of Mexican population concerns water availability. Although pressure on this natural resource reaches 17% at a country level – regarded as moderate in the international classification -, pressure may reach levels of up to 47% (deemed high) in central, northern and northeastern zones, which concentrate the majority of Mexico’s population and the country’s main economic activities. This has led to an overexploitation of water supplies (in 2007, 15% of the country’s aquifers were already overexploited [CONAGUA, 2008]). Areas with overexploited local aquifers have required importing water from other places, as in the case of Mexico City, where water is supplied from the Estado de Mexico, Guerrero and Michoacan states to meet the local population needs.
Notes 1For information on the world population please refer to the United Nations Population Fund webpage (www.unfpa.org), and for Mexico’s population, to the Mexican National Population Council webpage (www.conapo.gob.mx). 2Demographic transition is a shift from high mortality and fecundity rates to controlled low mortality and fecundity rates. 3The dependency ratio has two components: juvenile dependency [population aged 0-14 divided by working-age population (15-64 years)], and the elderly’s dependency ratio (population aged 65 and over divided by population aged 15-64). The total dependency ratio is the sum of both indicators. 4Rural localities are human settlements with less than 2500 inhabitants; localities with mixed urban-rural characteristics or undergoing transition concentrate 2,500 to 14,999 inhabitants; urban localities include 15000 or more inhabitants (Anzaldo-Gómez y Rivera-Vázquez, 2006).
|
