| CHAPTER 7. WASTE |
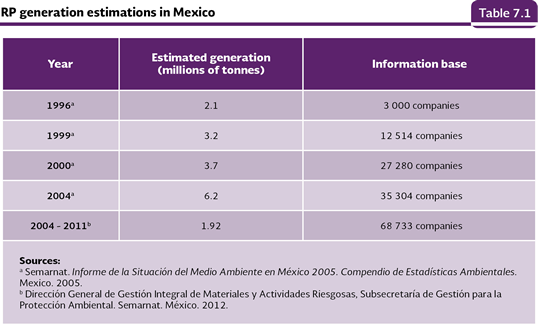
HAZARDOUS WASTE The great chemical substance diversity there is nowadays, although it has been used to significantly improve the population life quality, it has also placed an important pressure over the environment and the human health (see Box The Chemical substances in figures). Once the useful life of many of the products manufactured from these substances or the ones which contain them is over they turn into waste jeopardizing the health of the people or they may damage the environment. Among that waste the hazardous waste is found there, such waste is defined as those which owe any of the CRETIB characteristics that confer them dangerousness (corrosion, C; reactivity, R; explosivity, E; toxicity, T; flammability, I; or infectious-biological, B), as well as the containers, recipients, freight and soils which have been polluted, according to what is stated in the General Law for the Prevention and Integral Management of Waste (LGPGIR). The Mexican Official Standard NON-05-SEMARNAT-2005 establishes the characteristics, identification procedure, classification and the hazardous waste listings. Hazardous waste generation The first studies to estimate the volume of hazardous waste generated in the country were developed in 1994 by the National Institute of Ecology (INE). From then on, the figures have been diverse, and they have been primarily based on the information reported by the companies that generate or treat this kind of waste. The most recent approximation about the RP generation volume for the country is obtained from the records the companies registered in the Register of Hazardous Waste Generators (PGRP) file before Semarnat. According to the information contained in such record, for the period 2004-2011, the 68,733 registered companies generated 1.92 million tonnes (Semarnat 2012; Table D3_WASTEP01_01). However, this figure should not be viewed as the total RP generated volume in the country in that period, since the PGRP does not include all of the companies that produce this type of waste in the territory. The differences between this last RP generation estimate with the ones reported in previous years (Table 7.1), are mainly due to: 1) the number of companies and delegations that were used to calculate the generated volume; 2) the cleansing of the register and the review of the generation reports from the delegations that allow to eliminate company duplications, as well as the RP generation estimate mistakes made by the generators; and 3) the amendment of the NOM-052-SEMARNAT-1993 (currently NOM-052-SEMARNAT-2005) that states the waste characteristics to be considered as dangerous, and from which the mining tailings and the oil drilling cuts were eliminated, which were an important fraction of the total RP generated reported in previous estimates (Semarnat, 2009; see Box Mine tailings and drilling cuts in the 2008 Edition of the Report).
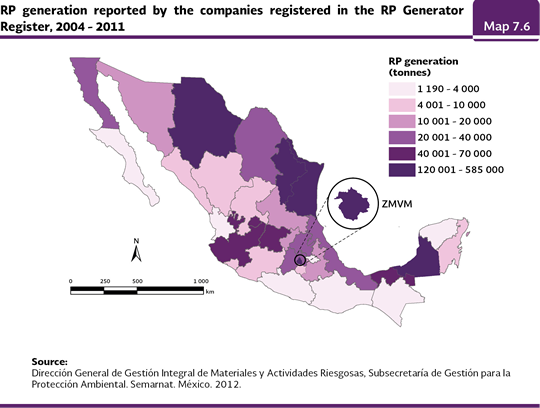
The largest RP generation volumes were in the Metropolitan Area of the Valley of Mexico (ZMVM; 584,666, in other words, slightly over 30% of the generated total volume), followed by Chihuahua (342,650, 18 %), Campeche (210,037, 11%), Tamaulipas (146,993, 8 %) and Nuevo León (128,849, 7%; Map 7.6). In contrast, the States that reported lower RP volumes were Nayarit (1,190), Baja California Sur (1,414), Chiapas (1 555) and Tlaxcala (1,586), which as a whole contributed 0.3 % of the national total.
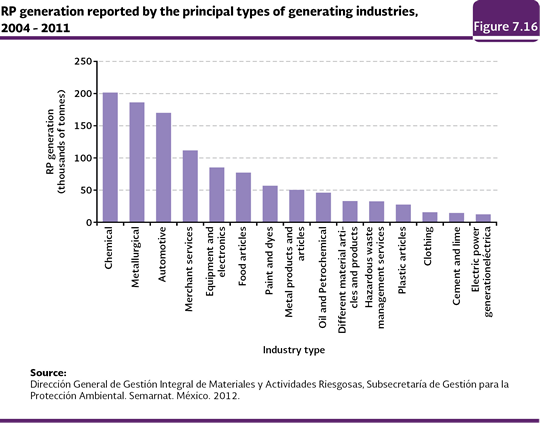
The RP generating industries that generated the highest volumes between 2004 and 2011 were the chemical (201,782 tonnes; 10.5% out of the total of generated RP), metallurgical (186,393 tonnes; 9.7%), automotive (170,194 tonnes; 8.9%), merchant services (111,907 tonnes; 5.8%) equipment and electronic articles (85,283 tonnes; 4.4%; Figure 7.16).
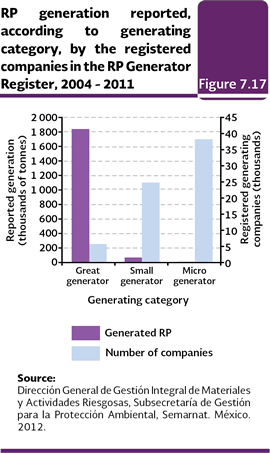
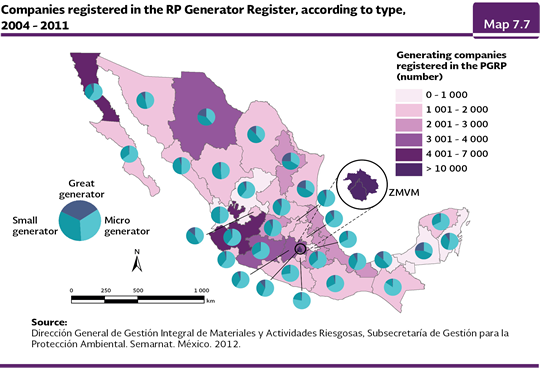
If the generation in function of the generator category5 is examined (micro, small and large generator) as well as the activity sector, for the period 2004-2011, the 38,194 micro generators (56% out of the total of generators) produced 10,948 tonnes (barely 0.6% of the total reported volume for the period); the small generators (24,772 companies, 36%) reported a generation of 71,215 tonnes (3.7 %) and large generators (5,767 companies, 8%), produced 1, 838,246 tonnes, equivalent to 95.7% out of the total (Semarnat 2012; Figure 7.17; Table D3_WASTEP01_01).
Regarding the geographical distribution of the RP generating companies of the PGRP, the Metropolitan Area of the Valley of Mexico was the one that reported the highest figure between 2004 and 2011 (10,589 companies, 15.4% out of the total), followed by states such as Jalisco (6,979 companies, 10.2%), Baja California (4,416, 6.4%), Chihuahua (3,545, 5.2%) and the State of Mexico (3,379, 4.9%; Map 7.7); as a whole, they produced slightly more than 55% of the RP of the period. In contrast, the states with a fewer number of companies were Tlaxcala (433, 0.6% out of the company total), Nayarit (531, 0.8%), Quintana Roo (601, 0.9%) and Zacatecas (674, 1%; Table D3_WASTEP01_01).
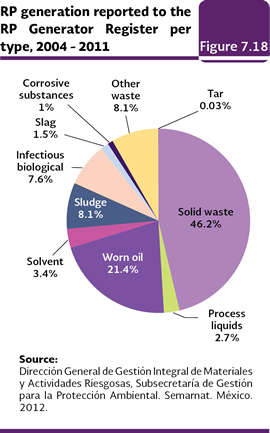
The highest percentage of micro and small RP generators was found in the Metropolitan Area of the Valley of Mexico (15%), Jalisco (10.7%) and Baja California (6.6%), as a whole accounted for 32.3% of them. In the case of the large generators, 43% of the companies were concentrated in the Metropolitan Area of the Valley of Mexico and Chihuahua and Nuevo León. Per waste type, between 2004 and 2011, the major generation fractions were the solid waste which include waste of automotive maintenance, asbestos, fabrics, leather and heavy metals, among others (886,715 tonnes, this is 46.2% out of the generated total), followed by the worn oils (410,532; 21.4%), sludge (156,025; 8.1%), infectious-biological (145,410; 7.6%) and solvents (65,470; 3.4%). The least generated RP were pitches (571.5 tonnes; 0.03% out of the generated total), the corrosive substances (19,866 tonnes; 1%) and the slag (28,086 tonnes; 1.5%; Figure 7.18; Table D3_WASTEP01_20).
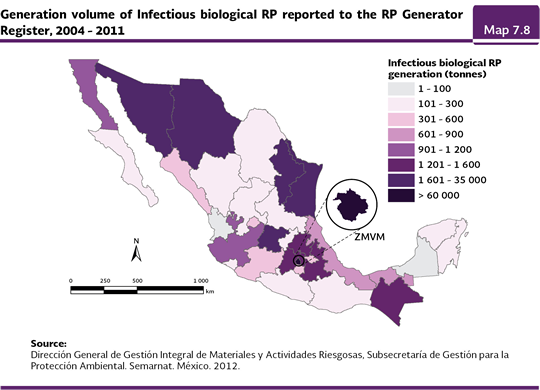
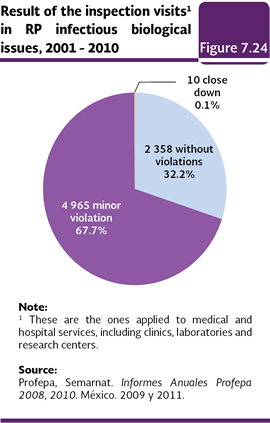
Due to the risks it represents for the health, the infectious-biological waste (RP-BI) is of great importance. Among them are the ones produced in hospital facilities and the ones provided by other health services, such as, because of the importance degree, the cultures and microorganism strains, sharp objects, pathologic samples and blood, among others. In the period 2004-2011, their generating volume was 7.6% out of the total of the RP generated at a national level, which is equivalent to 145,410 tonnes. 89% of the generation reported of this type of waste is concentrated in just a few states (Chihuahua, Nuevo León, Guanajuato and Tamaulipas) and in the ZMVM (Map 7.8). Per generated RP-BI 57.7% was for the non-anatomical ones, followed by the pathological (20.5%), the sharp objects (14.7%), blood (3.9%) and the cultures and strains (3.2 %; Table D3_WASTEP01_20).
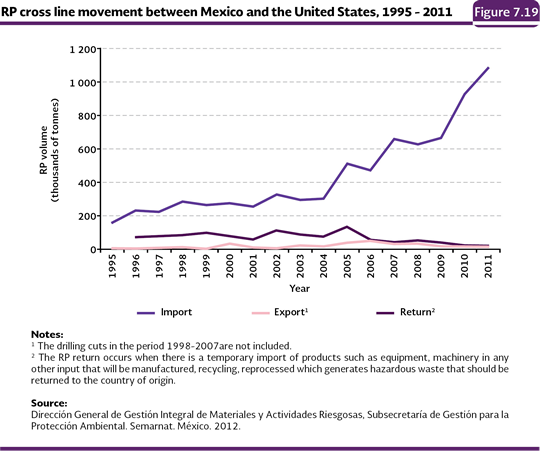
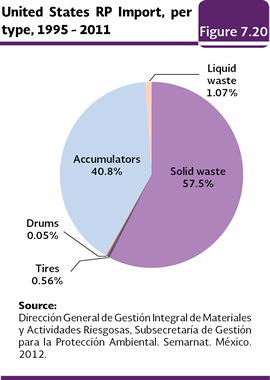
Cross border movement of hazardous waste Within the integral management of some RP is their movement among countries. The import, export or movement of this waste is basically present when its treatment recycling or reuse is sought in some of the involved countries, just when there is the acceptance or consent of the receiving country. In the case of the RP movement between Mexico and the United States, it is carried out by three ways mainly: 1) the national industry that exports it RP, 2) the Mexican recycling companies that import the waste for their industrial processes, and 3) the RP return present when some products are temporarily imported such as equipment, machinery or any other good which will be refurbished, recycled, reprocessed which generate hazardous waste that must be returned to the origin country. Between 1995 and 2011, it was observed a growing tendency in the RP import from the United States for its recycling and reuse: it went from a little over 158.5 thousand to 1.08 million tonnes (Figure 7.19). 98.3% of the total import was solid waste and accumulators and the remaining 1.7% was liquid waste, tires and drums (Figure 7.20).
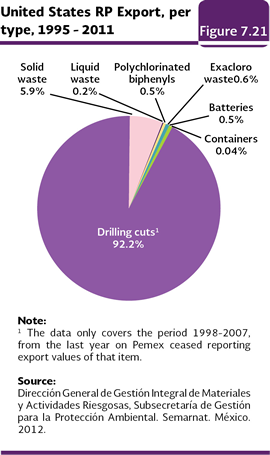
On the other hand, between 1996 and 2011, the RP that entered in the return category accumulated a total of 1.11 million tonnes, with an annual average of slightly more than 69.6 thousand tonnes. In the case of exports, in the same period, they accounted for a little more than 330 thousand tons, with an annual average of 19,421 tonnes (Tables D3_WASTEP01_02; D3_WASTEP01_03 and D3_WASTEP01_04). In the case of exports, in the period 1995-2011, the highest volume was for the drilling cuts (3,909,473 tonnes; 92.2% out of the exported total), followed by the solid waste (251,796, 5.9%), hexachord waste (26,725; 0.6%) and batteries (22,897; 0.5%; Figure 7.21; Tables D3_WASTEP01_02 and D3_WASTEP01_03).
In the case of the RP cross border movements with other countries, during the period 2003-2011, 69 RP import authorizations were granted, such imports were from Canada, Costa Rica, El Salvador, Honduras, Panama, Puerto Rico, Brazil and Argentina, with a volume of 152,624 tonnes, 126,750 (83%) out of which were used electric accumulators, 22,531 (14.8%) were high copper content sludge, 3,117 (2%) was antimonials lead dusts and 226 (0.15%) was worn oils, car catalytic converters and worn out batteries (DGGIMAR, Semarnat, 2012). Concerning the RP exports for the same period, 114 export authorizations were granted to Germany, Austria, Canada, Korea, Spain, France, Finland and Switzerland, with a volume of 75,703 tonnes, 42,799 (56.5%) of which were worn nickel base catalysts, 23,400 (30.9%) was material contaminated with acidosis 2, 4 dichlorophenoxyacetic acid, 5,126 (6.8%) was solids and liquids contaminated with polychlorinated biphenyls and 4,378 (5.8%) which include used accumulators, organochlorine compounds with hexane, waste of lead antiknock and wastes of lithium batteries, among others (DGGIMAR, Semarnat, 2012).
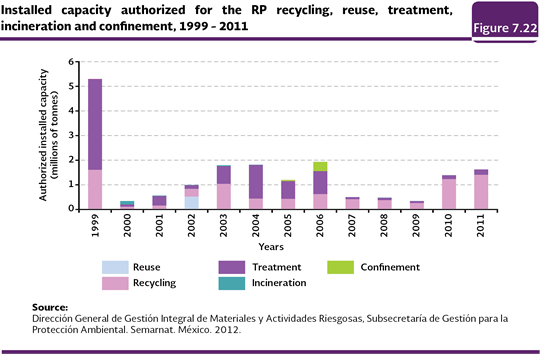
The hazardous waste may be handled and/or disposed in a safe way in different forms: a) recycling and reuse before its treatment and final disposition, b) by means of a treatment that reduces its dangerousness, c) by incineration under controlled conditions, and d) by its confinement in proper site for this. In order to carry out these processes, the waste must be previously moved, in a sage way, from their origin sites to the facilities where they will be handled or disposed for their confinement. At state level, in 2011 the only ones with authorized facilities to collect and transport the RP were Mexico City (500 tonnes; 66.5% out of the total infrastructure), State of Mexico (246 tonnes; 32.7%), Nuevo León (4 tonnes; 0.5 %) and Jalisco (2 tonnes; 0.3%; Table D3_WASTEP01_17). Between the RP collection and its treatment or final disposal there may be a requirement of the called temporary storing or waste collection, where it remains stored for a while waiting to be taken to the following handling stage, according to the timing stated in LGPGIR. Since the authorized facilities to carry out the waste temporary storing do not report the annual storing volume reached every year, the authorized installed capacity is what is reported. In 2011, there were four authorized facilities for the RP temporary storing, with an installed capacity of 10,198 tonnes; these plants were located in the State of Mexico (3 facilities, 198 capacity tonnes) and Nuevo León (one facility, 10,000 tonnes; Table D3_WASTEP01_16). On the issue of PR handling, the authorized installed capacity for recycling, use, re-use, treatment, incineration and confinement in the period 1999-2011 is shown in Figure 7.22. The installed capacity should be understood as the RP handling volume in any of its types, the Semarnat authorizes to the companies which request an authorization to do it. Due to the former, the actual RP volume that is recycled, treated, re-used, incinerated or confined must not be mistaken, because the plants of the authorized companies could not operate at full capacity. In 2011, the authorized installed capacity reached a little more than 1.6 million tonnes, being just for (1.4 million; 86.5% out of the total) and treatment (216 thousand; 13.5%).
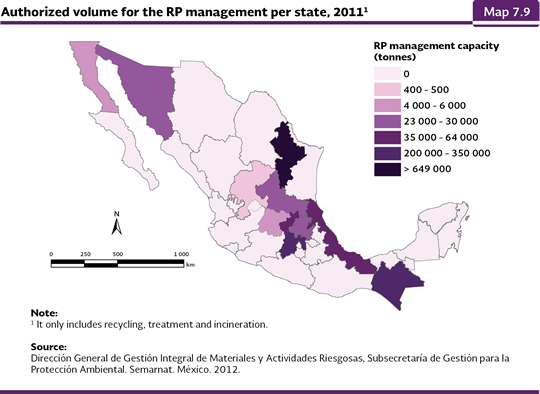
From the volume authorized by the Semarnat to the states for the RP handling in 2011, 86.5% was recycling and the remaining 13.5% was about treatment. Nuevo León was the only state with authorized capacity for RP treatment (a little more than 216 thousand tonnes), while for recycling, the largest installed capacity was authorized to the same state (nearly 649,970 tonnes; 47% of the national authorized treatment capacity), followed by Chiapas (345 thousand; 25%), State of Mexico (202,280; 14.6%), Querétaro (63,379; 4.6%) and Veracruz (35,977; 2.6%; Map 7.9 ; Tables D3_WASTEP01_07, 08, 09,15, 16 and RESIDUOP01_10_D).
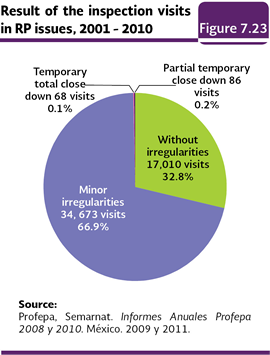
The Federal Attorney’s Office for Environmental Protection (Profepa) enforce inspection and monitoring programs to verify the fulfilling of the General Law for the Prevention and Integral Management of Waste which forces the RP generators and managers to handle it in a safe way as well as environmentally adequate (DOF, 2003). By means of the inspection visits irregularities are identified, corrective measures are given and closing are imposed in a case there are serious irregularities which represent an imminent hazard to the ecologic balance, serious damage to the natural resources or pollution with dangerous implications for the ecosystems or the public health. The fulfilling of the corrective measures is followed dup through verification visits. In the period 2001-2010, 51,837 visits7 to the establishments registered as hazardous waste generators were carried out. 17,010 visits did not present irregularities (32.8%), 34,673 had minor irregularities (66.9%), 86 had temporary partial closings (0.2%) and 68 had temporary total closings (0.1%; Figure 7.23; Profepa, 2011).
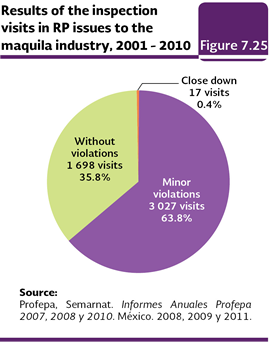
On the other hand, the maquila sector between 2001 and 2010, a total of 4,740 visits; 1,698 did not have any violations (35.8%), 3,025 had minor violations (63.8%) and only in 17 cases (0.4%) closings were received because of problems in the handling of waste (Figure 7.25).
Notes: 5 According to the recorded generation, the companies are classified as: 1) micro generators, which are the industrial, commercial or service establishments that generate up to four hundred kilograms of RP per year; (2) small generators, which generate volumes equal to or greater than four hundred kilograms and lower than ten tonnes in total gross weight of waste per year; and 3) large generators, which generate volumes equal to or greater than 10 tonnes in total gross weight of waste per year. 6 The information about the exports of drilling cuts just cover the period 1998-2007; from the latter year, Pemex stopped reporting the export values for this item. data on the export of drilling cuts only cover the period 1998-2007; from that last year Pemex ceased to report export values for that item 7 More than one inspection visit to the generating establishments may be carried out. 8 The inspection activities are carried out in medical and hospital service units, including clinics, laboratories, and research centers.
|