| CHAPTER 7. WASTE |
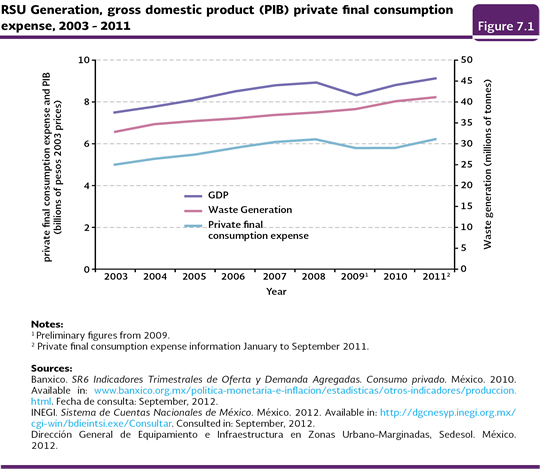
The escalation of the industrialization that was promoted in Mexico during the second half of the last century, produced an higher demand for raw materials to meet the growing consumption of goods and services of growing population with changing consumption patterns every time more demanding. At the same time, there was a growth in the generation of waste from different types with the problems related to its proper disposal and the associated problems for its proper disposal, as well as the effects on the human health and on the ecosystems (see Box Impacts of wastes on the population and the ecosystems). Waste is defined in the General Law for Prevention and Integral Management of Waste (LGPGIR) as those materials or products thrown away by its owner or possessor, which are found in a solid, semi-solid, liquid, or gas state contained in recipients or deposits; they may be subject to be valued or treated or disposed according to provisions stated in the same Law (DOF, 2003). Depending on their characteristics and origins, they are classified into three major groups: urban solid waste (RSU), waste of special handling waste (RME) and hazardous waste (RP). URBAN SOLID WASTE The urban solid waste1 is that which is generated in households as a result of the elimination of materials that are used in domestic activities (i. e. from consumption products and their containers or packaging) or those which also come from any other activity developed inside the premises or in the street, with household characteristics, and the resulting ones from streets and public places as long as they are not regarded as waste of another nature (DOF, 2003). Generation of urban solid waste The figures about the generation of RSU at the national level that have been reported in recent years show significant limitations, fundamentally, because it is not about direct measurements, but estimates. They are calculated by the Secretariat of Social Development (Sedesol) according to what it is stated in the standard NMX-AA-61-1985 about the Calculation of Solid Waste Generation. According to such entity, in 2011 there was a generation of about 41 million tonnes, equivalent to about 112.5 thousand tonnes of RSU per day. The generation of RSU has increased remarkably over the past years; just between 2003 and 2011 it grew 25%, mainly as a result of urban growth, industrial development, technological changes, population spending2 and the change in consumption patterns (Figure 7.1; Table D3_RSM01_02; IB 4-1).
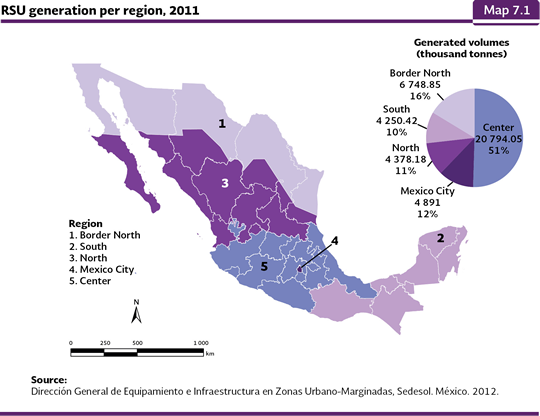
The total RSU generation in the country differs significantly at the geographical level. If the regionalization made by the Sedesol for the analysis of the waste generation is considered, in 2011 the region Center contributed with 51% of total generation in the country, followed by the region Border North (16%) and Mexico City (12%; Map 7.1; Table D3_ RSM01_01). If the evolution of the RSU generation per region is analyzed, the regions that increased their generation the most between 1997 and 2011 were: Border North (207%), Center (49%), South (44%) and Mexico City (19%). The only region that showed a reduction in that period was the North (27%), which went from 6 to 4.4 million tonnes in the same period.
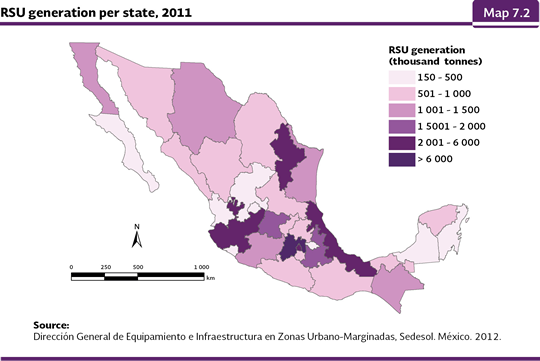
By state, the ones that generated the largest volumes of RSU in 2011 were the State of Mexico (16% of the national total), Mexico City (12%), Jalisco (7%), Veracruz (5.5%) and Nuevo León (5%), while those that registered the lowest volumes were Nayarit and Tlaxcala (each one of them with 0.8%), Baja California Sur and Campeche (each one of them with 0.6%) and Colima (0.5%; Map 7.2; Table D3_RSM01_04).
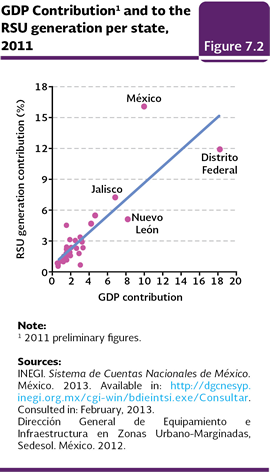
If the relative contribution of the states to the Gross Domestic Product is analyzed, it may be seen that it keeps a positive linear relationship with their participation in the RSU national generation (Figure 7.2). However, the contribution to the RSU total national production from states such as the State of Mexico and Mexico City, significantly differ from the tendency the rest of the states follow.
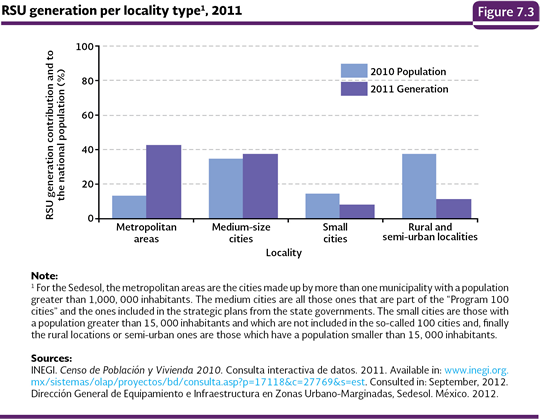
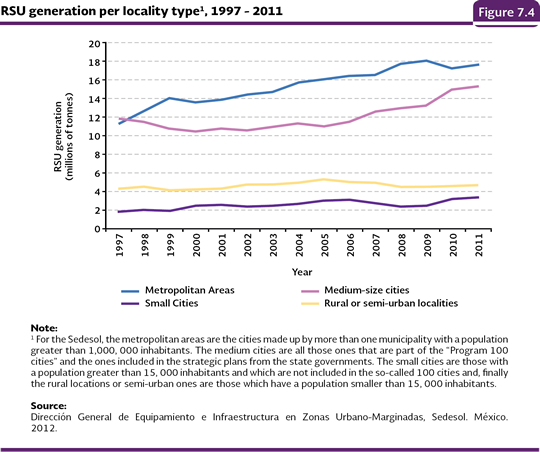
According to the size of the localities3, in 2011 the waste generation in rural or semi-urban localities (in other words, those with a population lower than 15 thousand inhabitants that host, as whole, 38% of the country population) was 11% of the national volume, while the metropolitan areas (with more than a million inhabitants, which hosted 13% of the national population) contributed with 43% of the total waste (Figure 7.3). The evolution of the waste generation per locality type between 1997 and 2011 shows that small cities are the ones that in percentage terms mostly increased their generation volumes (in 82%, it went from 1.9 to 3.5 million tonnes), followed by the metropolitan areas (57%, from 11.2 to 17.6 million tonnes) and the medium size cities (30%, from 11.8 to 15.3 million tonnes; Figure 7.4). The rural and semi-urban localities were the ones that had the lowest percentage growth recorded in the same period: 7%, from 4.4 to 4.7 million tonnes.
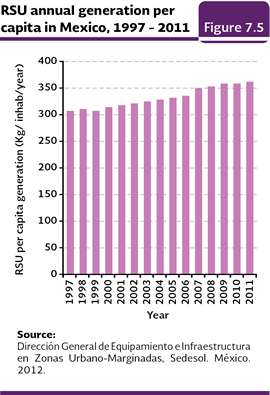
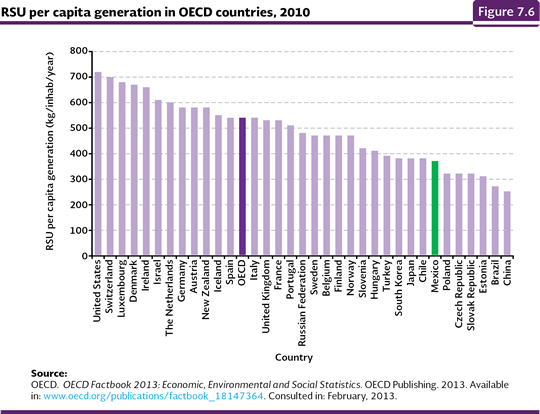
If the RSU generation per inhabitant is estimated, it is observed it has dramatically increased over time: between 1950 and 2011, the daily generation volume increased more than three times, going from 300 to 990 grams in average. If it is annually evaluated, the per capita generation went from 306 to 360 kilograms between 1997 and 2011, in other words, it increased in average 3.9 kilograms per year (Figure 7.5; IB 4-2). In comparison with the countries of the Organization for Economic Cooperation and Development (OCDE), the national per capita generation in 2010 (370 kg/inhab) was 31% lower than the average for the countries that make up such organization (540 kg/inhab/year in 2010; Figure 7.6). In that year, an average Mexican generated 14% more waste than a citizen from the Czech Republic and nearly 79% of the volume produced by an average Norwegian (OCDE, 2013).
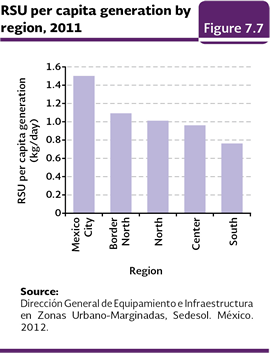
Among the states and certain country regions, the per capita generation shows important differences, as a result, basically, of the influence of culture, income level and urbanism degree factors, among others (Table D3_RSM01_01). In 2011, the of Mexico City region recorded the highest per capita generation, with 1.5 kilograms a day, while the inhabitants of the Southern region generated an average of 0.76 kilograms a day (Figure 7.7).
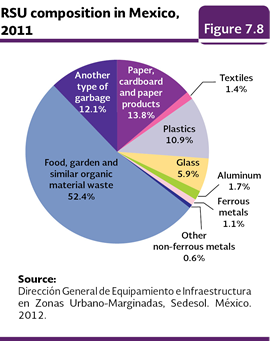
In terms of their composition, the RSU have also significantly changed in the last decades in the country. In general, the composition depends, among other factors, on the consumption patterns of the population: countries with lower income produce less waste, with the organic matter as the dominant type, while in the countries with a higher income, the waste is mostly inorganic type from manufactured products and with a higher percentage of products and (BID-OPS, 1997). The case of Mexico illustrates the transformation between both economy types: in the 1950s, the organic waste percentage in the trash ranged between 65 and 70% of its volume, while for 2011 this figure decreased to 52.4%, (Figure 7.8; Table D3_RSM01_10).
Handling and final disposal of urban solid waste The RSU proper handling has as its final objective, in addition to protect the population health, by reducing their exposure to injuries, accidents, discomfort and diseases caused by the contact with waste, to avoid the potential impact they could cause on the ecosystems. However, the situation of the handling of such waste is far from being the adequate one throughout the country. As of today, it is relatively common that waste is deposited in spaces close to the communication pathways or in natural terrain depressions such as natural ravines, ravines and stream channels. In the waste life cycle, after their generation there are several important stages for its handling such as the collection, recycling and final disposal, which are treated deeply in the following sections. Practically, on the date for the closing on the period to include information in this report, the INEGI published the results of the National Census of Municipal and Borough Governments 2011, which presents new information about the RSU management in the country (see the Box The RSU in the National Census of Municipal and Borough Governments 2011). This information will surely enrich the knowledge on the subject, but it will require a deeper analysis that will take time. In this context, the data presented in this edition of the Report related to the RSU management still come from the Sedesol, which also allows assessing their evolution in time.
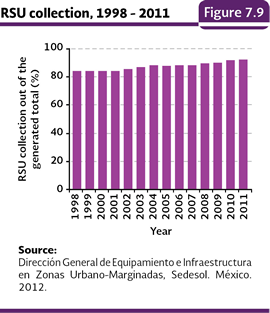
Collection In 1998, nearly 85% of the generated waste was collected, figure that in 2011 reached 93% (Figure 7.9; Table D3_RSM01_05). However, when the locality type is considered, the situation is different: in 2011, in the metropolitan areas of the country, the waste collection coverage reached 90%, while in the medium size cities was 80%, and in the small ones was 26% and in the rural and semi-urban localities reached 13% (Table D3 RSM01_08_D).
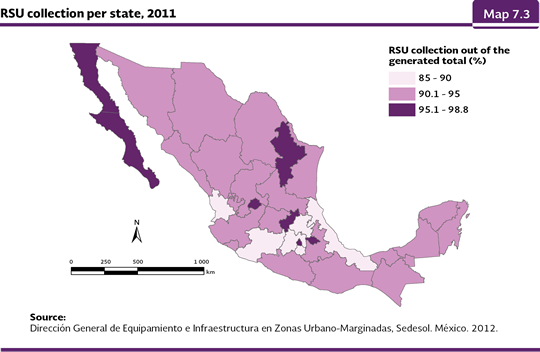
In 2011, the states that recorded the highest RSU collection were Aguascalientes (98.8% of the generated volume), Baja California Sur (97.7%), Nuevo León (97.6%), Baja California (97.5%), Mexico City (97%), Querétaro (96.5%) and Tlaxcala (95.8%; Map 7.3). The states with the lowest collection level were Michoacán (85.8%), State of Mexico (86.8%), Hidalgo (87.6%), Nayarit (89.3%), Veracruz (89.8%), Morelos (89.9 %) and Tabasco (90.3%; Map 7.3; Table D3_RSM01_05).
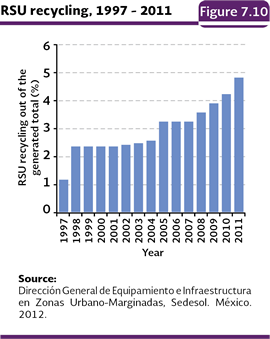
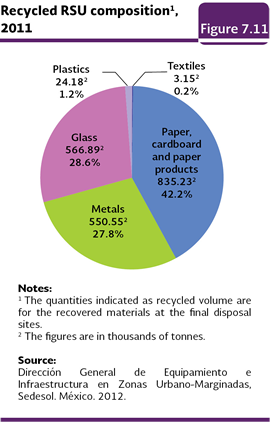
Recycling Although the recycled RSU volume in the country has increased in the past years, it is still low. According to the figures obtained at the final disposal sites, in 2011, 4.8% of the generated RSU volume was recycled; notwithstanding, this figure could reach 10% since many of the RSU which are subject to be recycled, are recovered (Figure 7.10; IB 4-5). Out of the total recycled RSU in 2011, the highest percentage was paper, cardboard and paper products (42.2%), followed by glass (28.6%), metals (27.8%), plastics (1.2%) and textiles (0.2%; Figure 7.11). On the other hand, if the recycled volume of each RSU type against its produced volume is analyzed, the most recycled solids in 2011 were the metals (39% out of the total generated metals), glass (23.5%) and the paper (14.7%). Hardly about 0.5% of the plastics and textiles is recycled each.
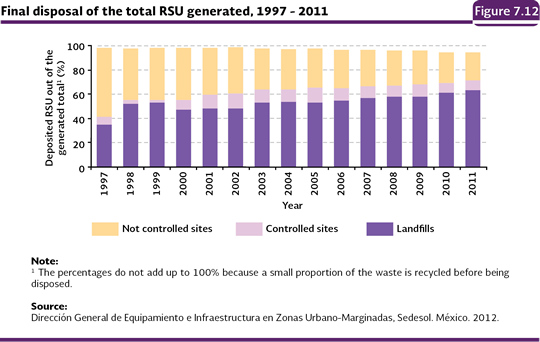
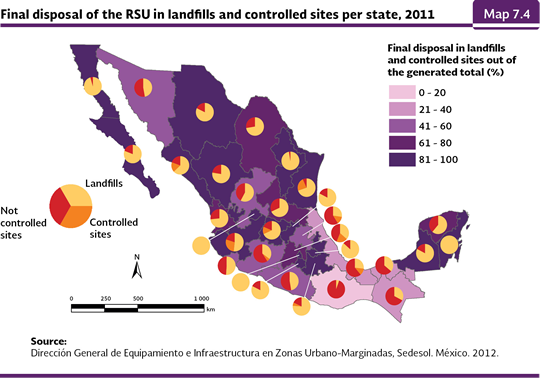
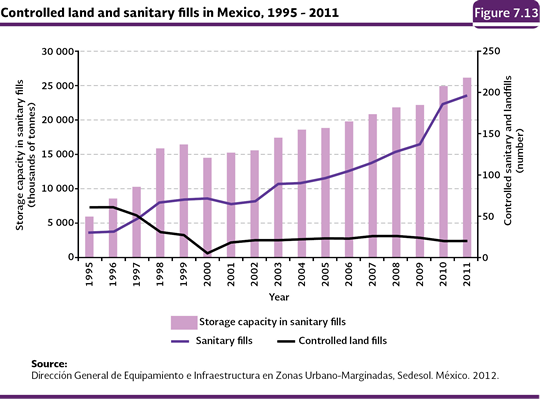
Final Disposal The waste final disposal refers to their permanent deposit or confinement in sites and facilities that allow avoiding their presence in the environment and the possible population health affectations as well as the ecosystems. In the country, there are two types of final disposal: the sanitary fills and the controlled landfills. The sanitary fills are the best solution for the final urban solid waste disposal; this type of infrastructure involves methods and particular engineering works which basically control the leachate leaks and the biogas generation. On the other hand, the controlled landfills, although they share the specifications of the sanitary fills about facilities and operation, they do no not meet the sealing specifications for the leachate control. The Mexican Official Standard NOM-083-SEMARNAT-2003 establishes specifications for environmental protection for the site selection, design, construction, operation, monitoring, closing and additional complementary works of a final urban solid waste disposal site and with a special handling. According to the standard, the sanitary fills must 1) guarantee the extraction, catching, driving and control of the generated biogas; 2) guarantee the catching and extraction of leachates; 3) to have rain drainage for the runoff deviations and the rain water dispersion; and 4) to control the dispersion of light materials, as well as harmful fauna and rain infiltration. In 2011 it was estimated that 72% of the RSU generated volume in the country was disposed in sanitary fills and controlled sites, 23% was deposited in non-controlled sites and the remaining 5% was recycled (Figure 7.12; Table D3_RSM01_09_D; IB 4-3). The percentage deposited in sanitary fills and controlled sites represent an increase of about 77% in respect to 1997, if it is considered that in the latter one, nearly 41% was deposited in this kind of sites. If it is analyzed per state, in 2011 Mexico City, Aguascalientes and Quintana Roo disposed the waste total amount in sanitary fills (Map 7.4). However, Oaxaca, Chiapas, Tabasco and Veracruz disposed less than 40% of their waste in this kind of sites (TableD3_RSM01_09_D).
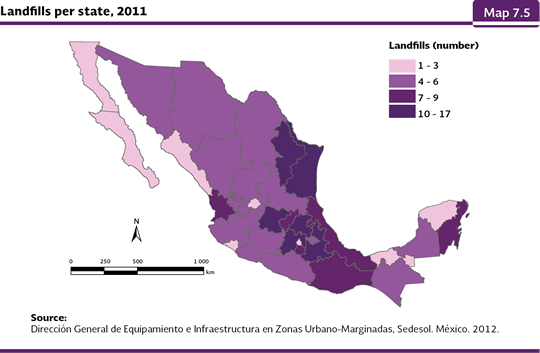
The number of sanitary fills in the country has grown significantly in recent years. Between 1995 and 2011 its number increased from 30 to 196, taking the total storage capacity from 5.95 to 26.14 million tonnes (Figure 7.13; IB 4-4). In 2011, there also were 20 controlled landfills. Currently, all of the states have sanitary fills to dispose their waste; the states which have more fills are Puebla (17), Nuevo León (14), Guanajuato (12) and Tamaulipas (11), while Mexico City and Aguascalientes have a sanitary fill (Map 7.5; Table D3_RSM01_07_D).
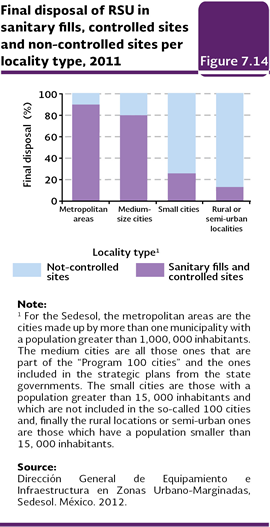
In general, the improvements in the sanitary fill issue have been mainly done in the big cities. When the proper disposal of waste per locality type is analyzed, in 2011 90% of the metropolitan areas adequately disposed their waste, while just 13% of the rural and semi-urban localities did it in the same way (Figure 7.14; Table D3_RSM01_08_D).
Notes: 1 With the publication of the General Law for Prevention and Integral Management of Waste (DOF, 2003), the municipal solid waste (RSM) changed its name to the urban solid waste (RSU). In this chapter they will be named with the last name, including those to which a reference is made before 1997, which was generated based on the Mexican Standard NMX-AA-61-1985, which establishes the method for the naming of the municipal solid waste generation (DOF, 1985). 2 It refers to the spending on private final consumption, in other words, to the total value of all the purchases of goods and consumption services, individual and collective, made by resident households, non-profit resident institutions and the federal government. It includes durable goods and non-durable goods and services, both in the internal market expense and the direct net purchases in the foreign market (INEGI, 2012). 3 For the Sedesol, metropolitan areas are the cities built by more than one municipality with a population of more than 1 000 000 inhabitants. Medium cities correspond to all those that formed part of the "Program 100 cities" and included in the strategic plans of the governments of the states. Small towns are those greater than 15 000 inhabitants and not included in the so-called 100 cities and, finally, the rural and semi urban localities correspond to those that have a population less than 15 000 inhabitants.
|