| CHAPTER 6. WATER |
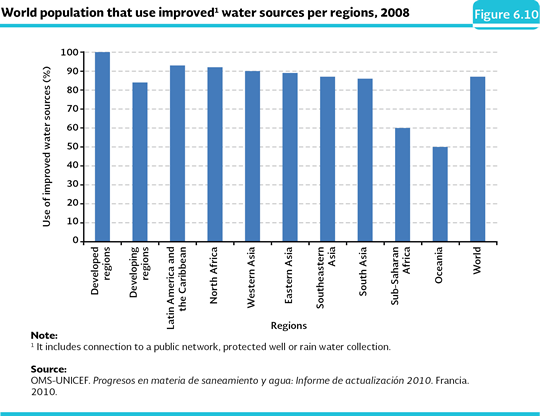
WATER AND POPULATION WELLBEING Services The well-being and the health of the population depend, at a great extent, on their access to the basic services, being the drinking water and the sewerage two of the most important ones. For many countries, it has been compulsory the boost towards the construction of hydraulic infrastructure that take these services to their growing populations. However, in many cases it has not been enough. The last world report of the Development Objectives of the Millennium states that, in 2008, about 884 million inhabitants (in other words, 13% of the world population) still did not have access to improved sources14 of drinking water (ONU, 2011). The latter happens mainly in the rural areas where there is not a possibility for the water to have a previous treatment to improve its quality and allows its use. At a regional level, South Asia, the Subsaharan Africa and Oceania had a percentage below the world one for the use of improved sources of water for consumption (Figure 6.10).
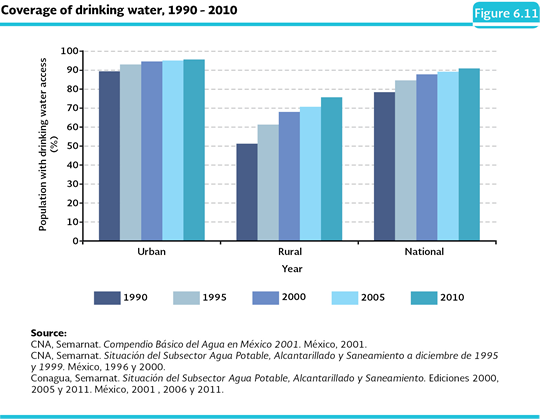
Drinking water In Mexico, the drinking water utility, along with the utilities of drainage, sewerage, treatment and disposition of wastewater are under the control of the municipalities, generally through operator entities. In 2011, the national coverage of drinking water15 reached 91.6% (Conagua, 2012; IB 2.1-11), a value over the world average recorded in 2008 (87%), but below the one estimated for Latin America and the Caribbean (about 93%) and for countries such as the United States, France and Canada, with a coverage that practically reach 100% of the population (OMS and UNICEF, 2010). The growth of the coverage at a national level increased 16% between 1990 and 2010 (Figure 6.11). At the locality level, in the same period, the coverage in urban areas moved from 89.4 to 95.6% (a 6.9% increase), while in the rural areas continued being considerably smaller, although with an important improvement, growing from 51.1 to 75.7%, which means an increase of 47.8% (Figure 6.11; Table D3_AGUA06_02).
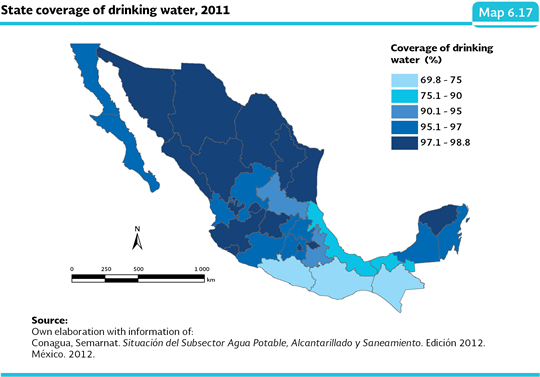
During the period 2000-2010, within the country, most of the states increased in real terms their coverage of utility; with important differences though (Table D3_AGUA06_01). States such as Aguascalientes, Coahuila, Colima, Mexico City, Nuevo León, Tamaulipas and Yucatán, in 2011 had drinking water coverage over 97% of their population; in Guerrero, Oaxaca and Chiapas had coverage below 80% (74.3, 77.4 and 79%; Map 6.17).
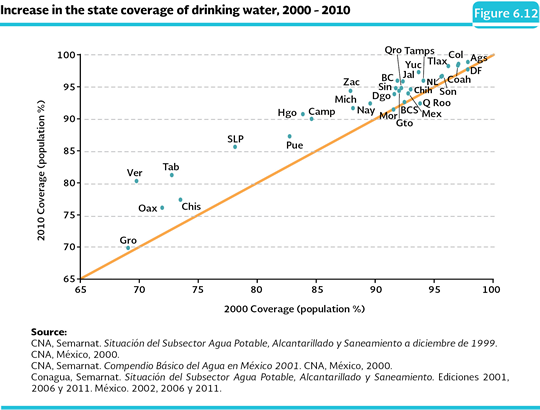
The differences in the efforts to increase the coverage of this utility are remarkable. During the first decade of the 21st century, Veracruz, Tabasco, San Luis Potosí, Hidalgo, Zacatecas and Campeche, which had coverage between 70 and 88%, achieved increases between 6 and 14% in such a period (Figure 6.12). States such as Quintana Roo, Mexico City, Morelos and Baja California Sur, that by 2000 had coverage over 90%, still face the challenge to reach the total coverage in a constantly growing population (Table D3_AGUA06_01).
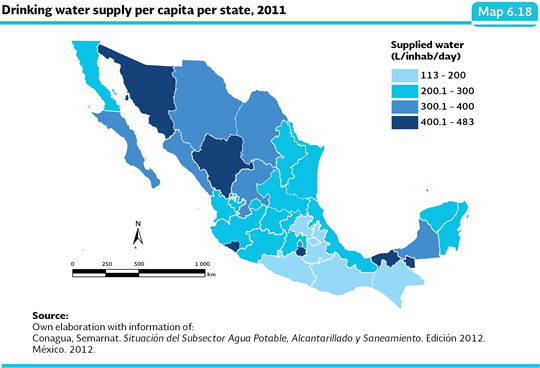
The supply of good quality water in the supply systems is important for the health and hygiene of the population, so, it is necessary to build specific facilities to purify it or disinfect it. The importance of these processes lies mainly in avoiding the appearance of diseases of hydric origin due to polluted water. In 2011, at a national level, 329,496 liters per second for human consumption were supplied, from them; 321,511 liters (97.6%) were disinfected. From the total supplied volume in the same year, 28.7% (94,647 L) went through the full clarification process (Tables D3_AGUA07_02 and D3_AGUA07_05). These figures may be translated in that, at a national level, about 252 liters per day per inhabitant were supplied, which is over the advisable minimum level according to the ONU of 50 liters of drinking water a day to meet the general necessities (food and cleaning) and over the 100 liters to meet the general necessities (FNUAP, 2001). Notwithstanding, the national values are not a reliable reflex of the situation at the state level, in 2011, Morelos, Colima, Tabasco, Sonora and Durango recorded supplies over 400 daily liters per inhabitant, while Oaxaca, Chiapas, Puebla, Hidalgo, Tlaxcala and Guerrero did not reach 200 liters (Map 6.18).
In 2011, at national level, the drinking water supplied that went through the full purification process and not just through the disinfection one was 71.3 daily liters per person. Tabasco had the largest volume per inhabitant, with 328 daily liters of drinking water per person, followed by Tamaulipas with 298 litters a day; while states such as Nayarit, Quintana Roo, Tlaxcala and Yucatán currently lack purification plants in operation.
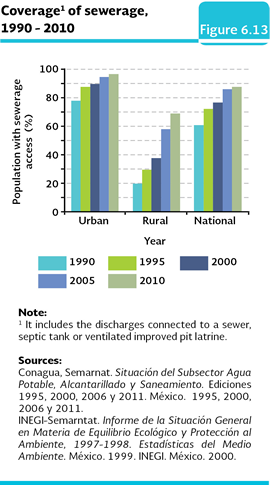
Sewerage system In Mexico, the sewerage coverage17 in 2011 was 90.2% (IB 2.2-11). Just like in the drinking water coverage, in the sewerage there are also very marked differences between the urban and rural areas: in 2011, the first ones reached coverage of 96.4%, while in the rural areas; they barely covered 69.4% of their population (Figure 6.13). At national level, the coverage increased 43.8% between 1990 and 2010. At locality level, in the same period, the coverage in urban areas went from 77.8 to 96.3%, while in the rural areas continued being remarkably smaller, with an important improvement though, growing more than three score, because it went from 19.8 to 68.9% (Figure 6.13; Table D3_AGUA06_02).
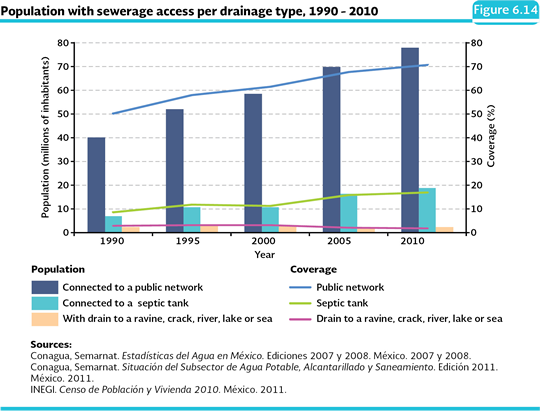
If it is analyzed by the type of sewerage service, the population that has a system connected to the sewerage network increased 43.8% between 1990 and 2010, while the population that had a septic tank almost doubled (99%) in the same period (Figure 6.14). On the other hand, the percentage of the population that did not have any sanitation source decreased 27% in the same period.
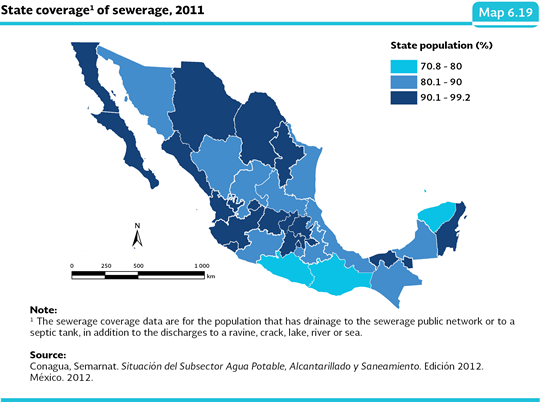
In 201118, the states of the country with sewerage coverage between 95.3 and 99.2% were Aguascalientes, Baja California, Coahuila, Colima, Mexico City, Jalisco, Morelos, Nuevo León and Tabasco; in contrast, Oaxaca, Guerrero and Yucatán did not reach 80% of their population with this service (Map 6.19).
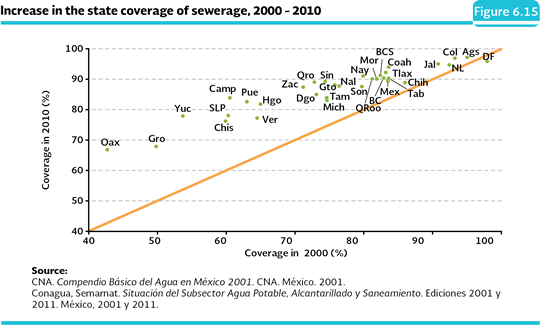
Although between 2000 and 2010, all of the states (with the exception of Mexico City) had an increase in their sewerage coverage, due to their efforts, Oaxaca, Yucatán, Campeche, Guerrero, Puebla, Chiapas, San Luis Potosí and Hidalgo stood out, with increases over 25% of their coverage at the beginning of the period (Figure 6.15; Table D3_AGUA06_04).
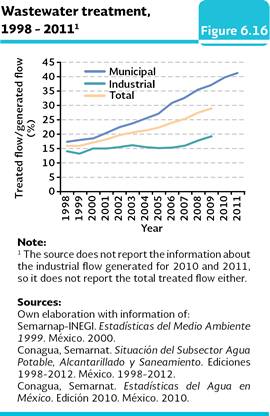
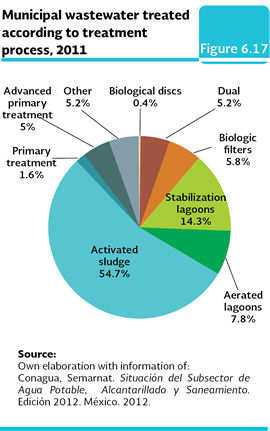
Wastewater treatment There are several biophysical treatment processes to remove the pollutants in the wastewater that come from the cities. Currently, the treatment processes of municipal waste waters in the country include activated sludge, stabilization ponds, advance primary, aerated lagoons, biological filters, dual and others19. By means of these processes, annually, it is possible to remove nearly 0.6 millions of cubic tonnes of DBO5 which are collected in the municipal sewerage out of the 2 million tonnes which are generated; these processes are also capable of removing about 19% of the organic charge from the industrial waters (Conagua, 2011). In 2011, there were 2,289 treatment plants of municipal wastewater and 3,033 treatment plants of industrial wastewater in operation (from which 2,995 are in operation, which represents 98.7% of the total). If just the generated municipal flow is considered, in that year 41.3% was treated, what represents a 141% increase compared to 1998 (in other words, 56.8 m3/s; Figure 6.16). Although the total amount of wastewater that is treated is still low, it is above the average of Latin America, which barely reaches 13%. From these results, it is clear that still many of the surface water bodies without treatment that cause their pollution and, as a consequence, affectations on the health of the population and the species that inhabit them.
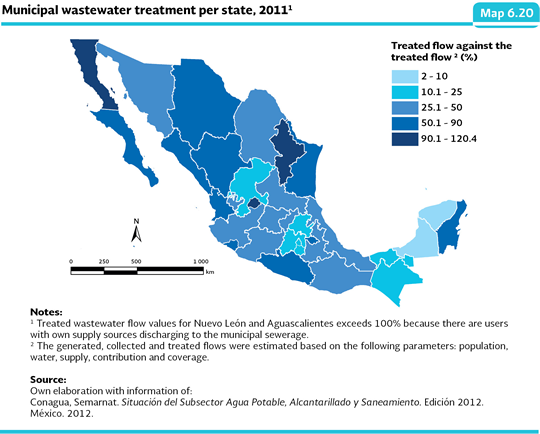
At the state level, it is very variable the percentage of wastewater that receive treatment in contrast to the generated flow: in 2011, Nuevo León, Baja California and Aguascalientes treated over 90% of the wastewater they generated, while states Campeche and Yucatán treated less than 5% (Map 6.20; IC 11).
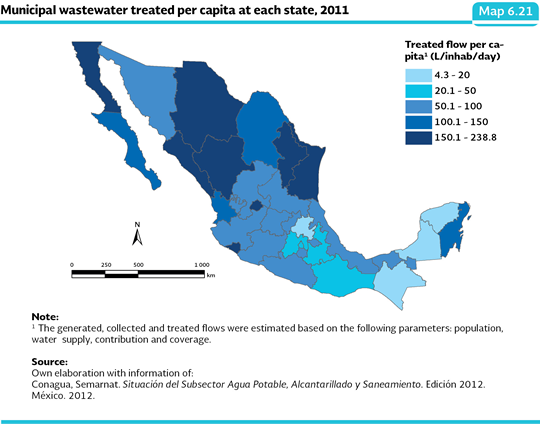
If it is analyzed per inhabitant, in 2011 at a national level an average of 73.5 daily waste water liters were treated, with marked differences among states: Aguascalientes was the state that treated the largest flow per inhabitant a day (238 L), followed by Nuevo León (186 L), Durango (175 L), Colima (175 L) and Chihuahua (160 L); on the other hand, the states that treated the smallest flow per capita a day were Hidalgo (12 L) and Yucatán (4 L; Map 6.21).
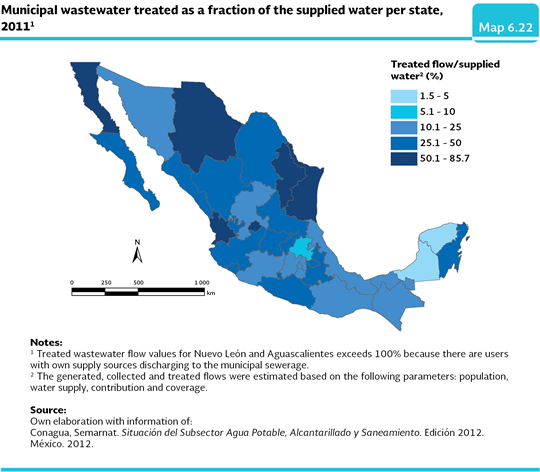
Another indicator of the effort the states do to treat the water is the relationship between the supplied liquid to the population and the treated water. The states that process in a larger proportion the water they provide to their population are Aguascalientes, Nuevo León, Baja California, Nayarit and Tamaulipas, with a relationship higher than 50%; in contrast, Yucatán and Campeche do not reach 5 % (Map 6. 22).
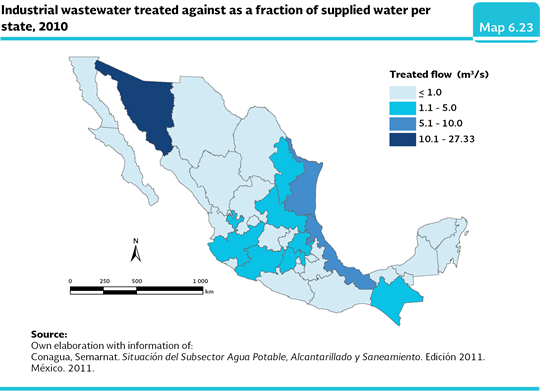
Concerning the treatment of wastewater of industrial origin, in 2010, the industrial treatment plants of the country processed 63,600 L/s and 1.3 million tonnes of DBO5 were removed. The states that treated in 2010 the largest volume of wastewater generated with an industrial origin were Sonora (27.34 m3/s nearly 43% of the total wastewater of the industrial type that were treated at a national level), Veracruz (8.70 m3/s), Tamaulipas (6.11 m3/s), Chiapas (3.34 m3/s) and Nuevo León (2.99 m3/s; Map 6.23; Table D3_AGUA07_09).
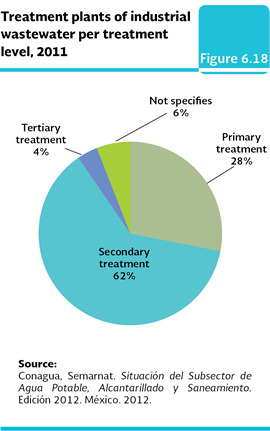
There are three types or levels of treatment systems, from which the most widely used is the secondary one, which is applied in 1,869 plants (Figure 6.18). The primary level systems are the most simple in the water cleaning (the treatments involve physical processes such as the screening, flotation or fat elimination and sedimentation); their role is to clean the water of particles whose dimension may obstruct the following processes. The secondary treatment level cleans the water from the impurities whose size much smaller than the ones caught by decantation and grates, for which, the mechanical and combined biological methods are used (these systems are very diverse and depend on factors such as the climate to make the appropriate selection; such as the percolation systems and the anaerobic ones). Finally, the tertiary treatment includes biological, physical and chemical processes.
Notes: 14 It includes the connection to a domestic, public, protected well or rain water collection network. 15 NOM-127-SSA1-1994 defines as freshwater that water that is used for human consumption which does not have objectionable pollutants, either chemical or infectious agents and that it does not cause nocive effects on the health. (DOF, 2000). 16 The improved sanitation service facilities include the discharges connected to a sewerage, septic tank or improved ventilated well latrine. 17 It exclusively refers to the percentage of the population that inhabits in private households that have a drainage connected to the public sewerage network or to a septic tank. This information is determined by means of the census and counts made by the INEGI. 18 Data of the sewerage coverage include, besides the improved sanitation (population that has drainage connected to the sewerage public network or a septic tank) the discharges to a slope, crack, lake, river or sea. 19 In 2003, the septic tank process was stopped and the use of aerated lagoons was favored (CNA, 2004).
|