| CHAPTER 6. WATER |
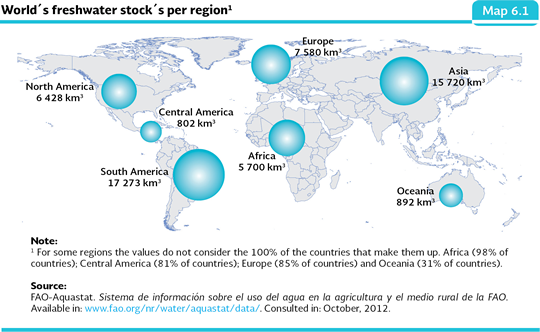
AVAILABILITY OF WATER Regional water reserves and balance of national water The water reserves in the world consider the total accumulated available volume2 of surface and groundwater. Map 6.1 shows the volumes of the reserves of world water: South America is the region with the largest renewable water3 resources of the planet (nearly 31.8% of the total), followed by Asia (28.9%) and Europe (13.9%); in contrast, Central America owns just 1.5% of the world total reserve.
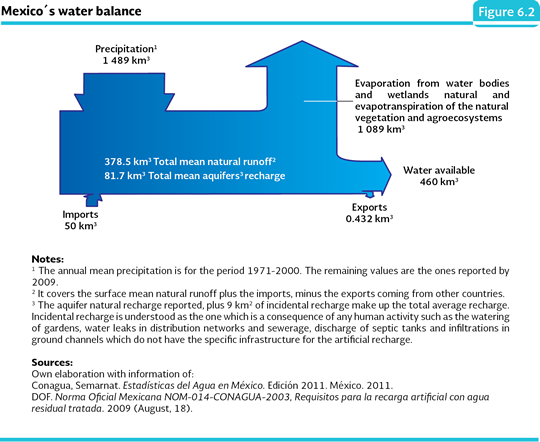
The availability of water of a region or country depends on the water balance, this is, the volume that is received by precipitation and what is lost because of the evaporation of the water bodies and because of the evapotranspiration of the vegetation. The remaining volume may go towards the recharge of the aquifers or runoff on the surface. Since the distribution of the precipitation and the evapotranspiration varies highly, the availability of the water resources show very important differences in the different regions of the planet. In Mexico, the average volume of water obtained by precipitation every year is 1,089 cubic kilometers; notwithstanding, the largest part, about 1,089 cubic kilometers (73.1%), goes back to the atmosphere through evapotranspiration, so it’s known as “green water” (Falkenmark and Rockström, 2004; Table D3_AGUA01_04). In addition to the water that enters through precipitation, Mexico receives about 50 cubic kilometers through the imports from the rivers in the north and Southern Borders and it exports 0.432 cubic kilometers from the Bravo River to the United States according to the Treaty about Distribution of International waters signed in 1944. In this way, the general balance shows that the average natural availability is of 460 cubic kilometers of water in average every year (Figure 6.2), value over the one of most of the European countries, but very low if it is compared to the one of the United States (3,051 km3), Canada (2,902 km3) or Brazil (8,233 km3; FAO, 2007).
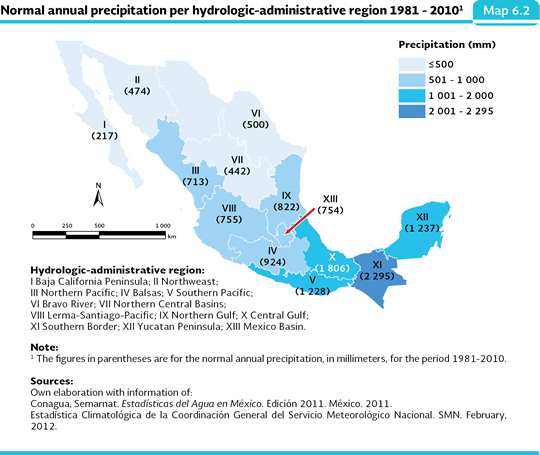
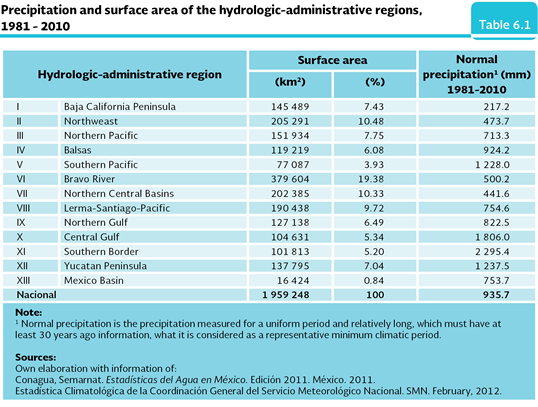
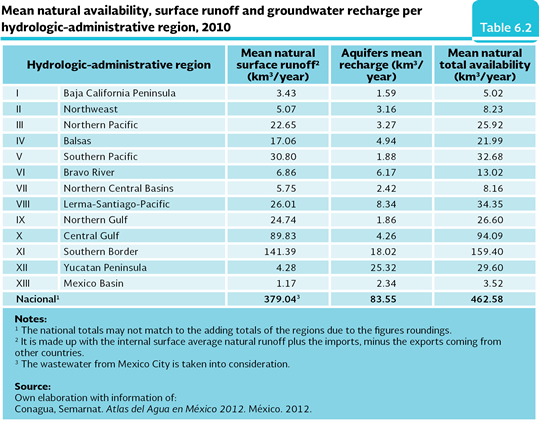
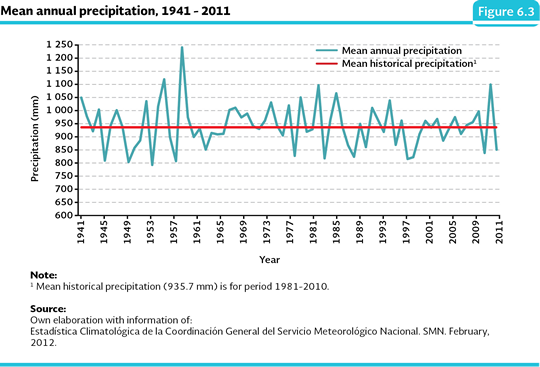
Spatial and temporal variability in the water availability In Mexico, the normal precipitation4 for the period 1981-2010 was 935.7 millimeters, volume which is considered as abundant (Conagua, 2011). However, it is little representative of the water situation throughout Mexico. For instance, in 2011, Baja California Sur barely recorded a little more than 70 millimeters of rain, while in Chiapas and Tabasco the annual precipitation reached 2,373 and 2,478 millimeters, respectively (Table D3_AGUA01_01). At the level of the hydrological-administrative regions5 which divide the country, the differences are also outstanding: during the 1981-2010 period, the Northern regions, the Baja California Peninsula, Northweast, Bravo River and Northern Central Basins, which take 47.6% of the national territory received, as a whole, 13.4% of the total, while the Southern Pacific , Central Gulf, Southern Border and Yucatán Peninsula, located in the south of the country, which takes 21.5% of the national territory, received 53.9% of the total (Map 6.2; Table D3_AGUA01_02; Table 6.1).
Concerning the national surface runoff, in 2009, 83% (378.5 km3) of the available volume in the country ran on the surface and the remaining 17% (81.7 km3) was incorporated to the aquifers (Figure 6.2). However, the surface runoff also shows important variations in the geography of the country: in that same year, in the Southern Border region ran nearly 37% of the national total (basically through Grijalva and Usumacinta rivers), while in the Baja California and Yucatán peninsulas, the surface runoff was close to one percent of the national value (Table 6.2; Table D3_AGUA01_08). In the case of Baja California, this is explained by its scarce precipitation, and for Yucatán, by its flat relief and by the permeable substrate which deter the formation of important surface runoffs. If the proportion of what runs in respect to the available water is taken into consideration, in 2009, the regions that showed the largest relative surface runoff were Southern Pacific (93.8%), Northern Gulf (94.8%) and Central Gulf (95.6%). In contrast, the proportion was lower in the regions Bravo River (42.4%), Mexico Basin (33.4%) and Yucatán peninsula (14.6%). The average natural availability is also heterogeneous among hydrological-administrative regions: while Southern Border, in 2010, had almost 160 annual cubic kilometers and the Central Gulf with a little more than 94, the Baja California peninsula barely had 5 and the Mexico Basin region just had available 3.5 annual cubic meters (Table 6.2).
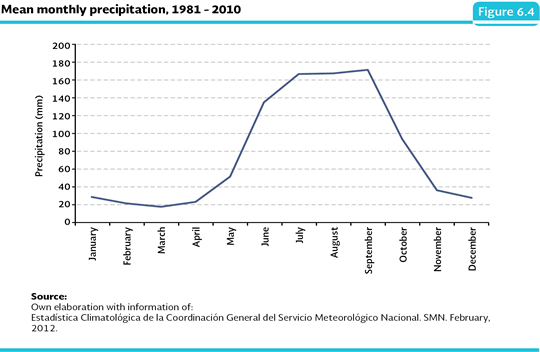
Concerning the seasonal variability, the precipitation also shows important differences. In 2010, the national precipitation values was 17.5% above the average of the 1981-2010 period (935.7 mm), while in the years 1982, 1988, 1995, 1996, 2009 and 2011 was below such average (Figure 6.3; see the Box Extreme meteorological phenomena: the case of the drought). Regarding the precipitation variation throughout the year, the largest volumes generally happen during the summer (Figure 6.4), while the low water period extends, in most of the country, between November and May.
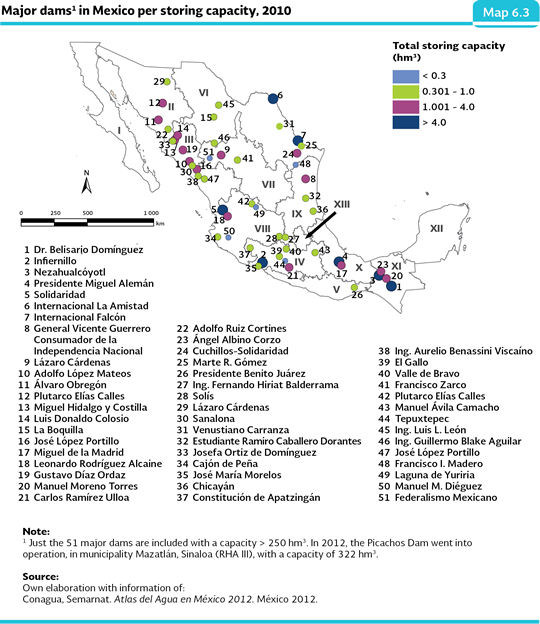
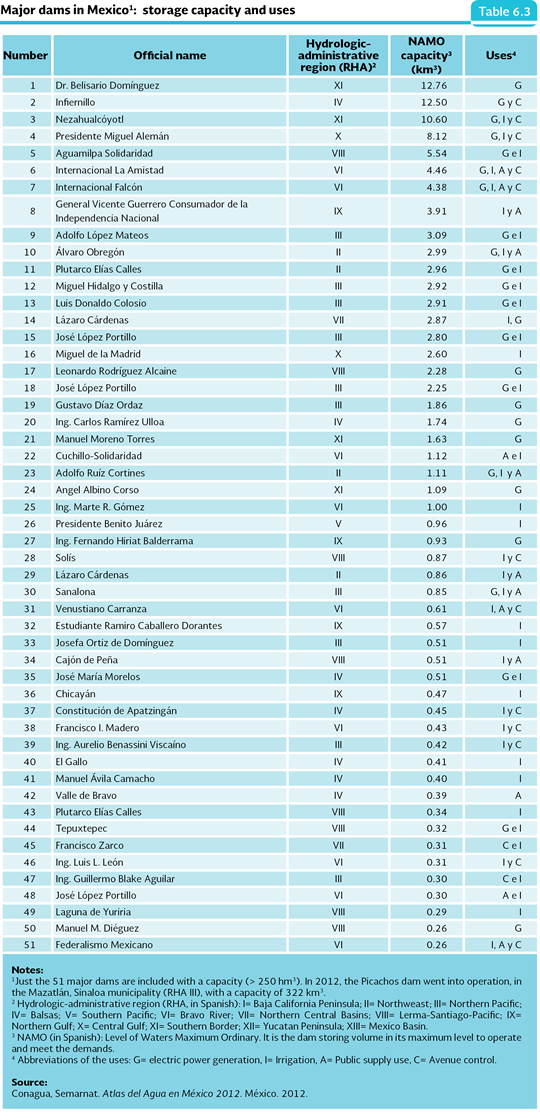
Stored water The volume of water stored in the lakes of the country (about 10 km3) is relatively small if it is contrasted to what it is just used for the annual national public supply, which is equivalent to almost 11 cubic kilometers (Table D3_AGUA01_06). This is caused, basically, because the Mexican orography does not allow the formation of deep lakes. That is why, in order to ensure the supply of the liquid for the different uses in the whole country, and taking into consideration the spatial and seasonal heterogeneity in the precipitation, an important network of water infrastructure in the form of dams and reservoirs has been built. With the exception of the Yucatán peninsula, where there are not surface water currents that allow the construction of this kind of infrastructure, the rest of the hydrological-administrative regions have dams. Most of the heavy flow rivers are partially or totally regulated through multiple purpose dams. There are 4,462 dams and water retention berms in the country, which represent a total storage capacity of about 150 cubic kilometers. From that number, 667 dams are classified as large dams because their storage capacity is larger than a cubic hectometer. The stored water volume in the dams does not just depend of their construction capacity, but also on the precipitation occurred in their catching basins and on the runoffs in the different country regions: for instance, in 2010, it was possible to store in the country 51 principal dams6 (and the largest ones) a volume of 102.1 cubic kilometers, in other words, nearly 91% of their total storage capacity; in a dry year, 1996 for instance, this volume hardly reached nearly 80 cubic kilometers, in other words, 71% of the capacity of such dams. Map 6.3 shows the 51 major dams (Table D3_AGUA01_07; IB 2.1-9).
Concerning the use of the dams of the country, 41 out of the 51 largest dams supply irrigation water (benefitting 6.5 million irrigation agriculture hectares and 2.9 million technified seasonal hectares), while 9 out of them are used for the public supply. Thirty three large dams have more than one type of use, among which are the power generation, irrigation, avenue control and public supply. Table 6.3 presents the 51 principal dams in the country, their uses and the capacity at the maximum normal water level (NAMO7).
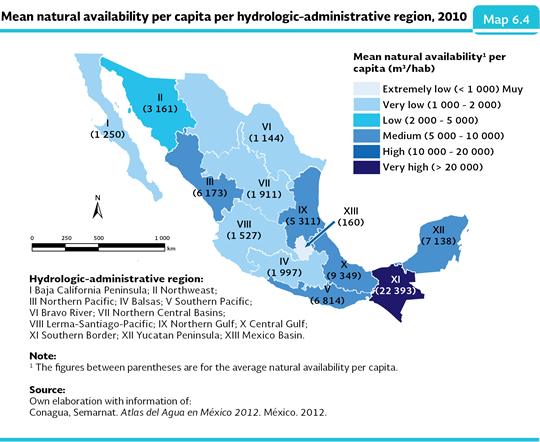
Per capita water availability Another way to evaluate the water availability is through the estimate of the water volume per every inhabitant (IB 2.1-5). This indicator has been commonly used as a measure of the possible stress that the inhabitants of a country or region may face. An availability lower than 1,700 cubic meters per inhabitant per year is considered as a water stress situation (Falkenmark indicator; UNDP et al., 2000), where frequently there may be a shortage of water for the several activities than use it, especially in countries prone to suffer droughts, as it is the case of Mexico. When the availability is lower than a thousand cubic meters per inhabitant per year, the consequences may be more severe and seriously jeopardize the food security and the economic development of the country. Regularly, under such circumstances, there is a temporary lack of water in some places and it is necessary to make decisions which involve use priorities among the agricultural, industrial activities or the supply to the urban and rural population (FNUAP, 2001). It is important to mention that the variations observed in the availability per capita over time mainly depend on the size of the population of the country or region for which it is estimated, and not on the decrease of the precipitation in the specific year. At a world level, the availability per capita has decreased dramatically in a few decades. In 1960, for every world citizen there were 11,300 cubic meters per year (MEA, 2005), which decreased to just 5 thousand cubic meters for 2010, when the world population was about 6,900 million (FAO, 2012). In Mexico, the availability has also decreased in an important way: in 1950, it was 17,742 cubic meters per year, going to a little less than 11 thousand in 1960 and to less than 8 thousand in 1970. In 2010, the availability per inhabitant was 4,090 annual cubic meters (Conagua, 2012; IB 2.1-1), a volume that, according to the World Resources Institute (WRI) is considered as a low availability. The water availability per inhabitant in Mexico is much lower than the availability in countries such as Canada (84,633 m3/inhab/year), Panama (42,577 m3/inhab/year) or the United States (9, 159 m3/inhab/year), and in general the whole South America, but slightly over the average of many of the European countries (FAO, 2012). By 2030, it is estimated the water availability per inhabitant will be just 3,800 cubic meters per inhabitant per year (Conagua, 2011). The national values per capita may mask water stress situations at a regional level. Mexico presents all of the category spectrum of water availability in its hydrological-administrative regions, which go from very high, high, medium, low, very low, until the extremely low (below 1,000 m3/inhab/year; Conagua, 2011). To illustrate such heterogeneity, the regions Mexico Basin and Southern Border Sur are good examples: while in the first one of them in 2010 had an availability of just 160 cubic meters per inhabitant per year (which classified in the availability category extremely low) the region Southern Border recorded in the same year 22,393 cubic meters, in other words, an availability nearly 140 times larger, classified as very high availability (Map 6.4; Table D3_AGUA03_01).
If the hydrological-administrative regions with very low availability are taken into consideration, 75 million inhabitants in the country (about 66% of the national population) were in a water stress situation in 2010. In the future, the availability per capita in some areas of the country could get worse significantly, according to a study of the United Nations Program for Development (UNDP), the water availability per capita for 2025 in the basins of the Balsas, Grande de Santiago and Colorado rivers may fall below 1,700 cubic meters per inhabitant per (UNDP, 2000).
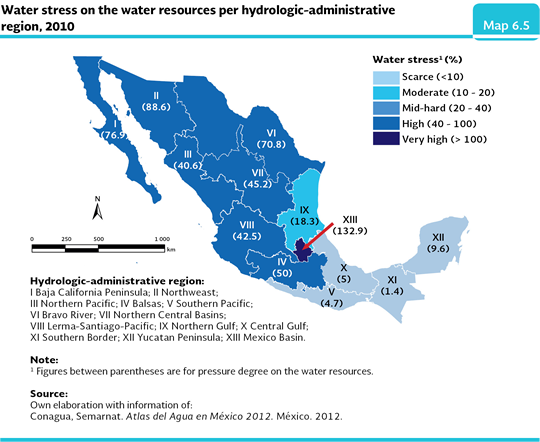
Water stress The water stress over the water resources (GPRH, in Spanish; IB 2.1-6 and IC 9) represents the proportion of available water that is extracted in an area, either for livestock, public, industrial purposes or for any other purpose about the renewable water resources. The UN Commission for the Sustainable Development (CDS) defines four categories to classify the pressure degree, which go from strong (the extraction surpasses 40% of the natural availability) until scarce (the extracted water does not surpass 10% of the available liquid). Some Middle Eastern countries (such as Arab Emirates and Kuwait), have a water stress Some countries from Middle East (such as Arab Emirates and Kuwait), show a pressure degree that could be graded as extreme, because they surpass 2,000%. that could be graded as extreme, because they surpass 2,000%. Mexico, with an estimated GPRH value of 17.4% in 2010, it is placed in the category of moderate pressure, a value over 11.5% estimated as average for the countries in the OCDE (FAO, 2012). Notwithstanding, this value is influenced very meaningfully by the high water availability in the south of the country, since in regions such as Southern Border, Central Gulf, Yucatán peninsula and Southern Pacific less than 8% of the available water is extracted. In contrast, the regions of Baja California, Northweast, Northern Pacific, Bravo River, Northern Central Basins, Balsas and Lerma-Santiago-Pacific, record water stress over 40% (Map 6.5). A particular case is the one about the Mexico Basin region, whose pressure value over the resource reached 132.9% in that same year.
Finally, another measure of the water availability is the one known as intensity of use (OCDE, 1998) or extraction per capita. According to this indicator, the extraction per capita in Mexico for 2010 was 709.9 cubic meters per inhabitant per year, a value very similar to the value of Spain (711 m3/inhab) and below the value of Bulgaria (811 m3/inhab), the Philippines (889 m3/inhab), Pakistan (1,076 m3/inhab) and the average of the countries members of the OCDE, estimated around 920 cubic meters per inhabitant per year (OECD, 2003; FAO, 2007).
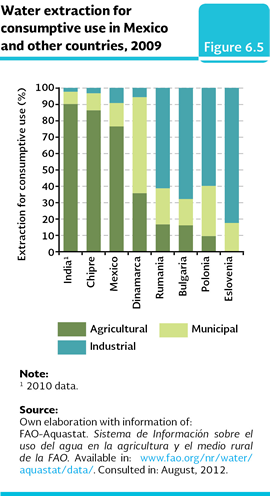
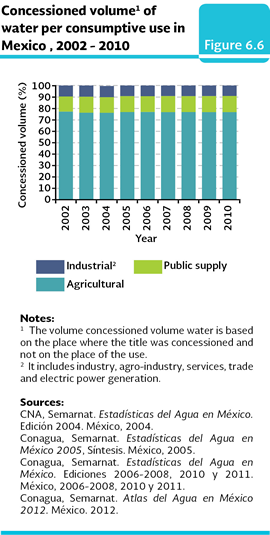
Water extraction and consumptive uses The extraction of freshwater in the world has grown dramatically in order to supply the agriculture, the power generation and the consumption of a population every time bigger. At a world level, the increase in the water extraction was slightly more than 50% in just 30 years, as it moved from 2,574 to 3,940 cubic meters between 1970 and 2000 (UNEP, 2002). The case of Mexico has not been very different: between 2002 and 2010 the volume granted for the agricultural, public supply and industrial use increased in almost 8 cubic kilometers, moving from 72.6 to 80.3 cubic kilometers, which represents 17.4% of the available water (IB 2.1-2; also see box Water footprint and virtual water). Concessioned volume of water for consumptive uses The water distribution for the consumption uses differs among countries and regions depending on its availability, the type and capacity of their industry and agriculture, as well as their population and their consumption patterns. In general, the water distribution in Mexico8 for its different consumption uses is similar to the one owned by countries such as Chipre or India, but it meaningfully differs from most of the developed countries, where the proportion assigned for industrial uses is much larger, as it is the case of Bulgaria and Slovenia (Figure 6.5).
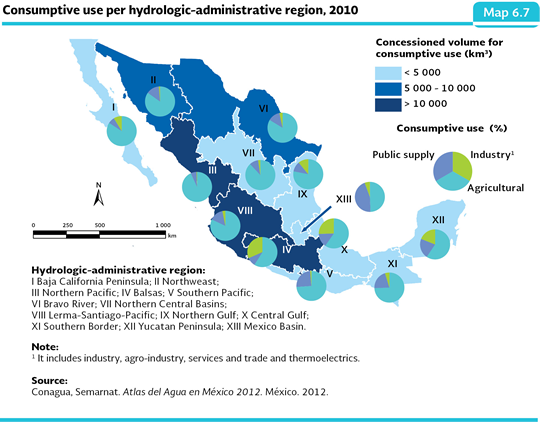
Most of the extracted water in the country is used in the agricultural activities: in 2010, nearly 77% was used for the irrigation of 6.5 million hectares (nearly a fourth of the sown surface), as well as for the livestock and aquaculture activities (Figure 6.6). It was followed by the public supply, 14% of the total volume of extracted water and the industrial and the electric power generation with 9%. For the non-consumption uses of water, in 2009 the hydropower used for the functioning a volume of 136.1 cubic kilometers to generate 26.4 TWh9 of electricity (11.3% of the national total).
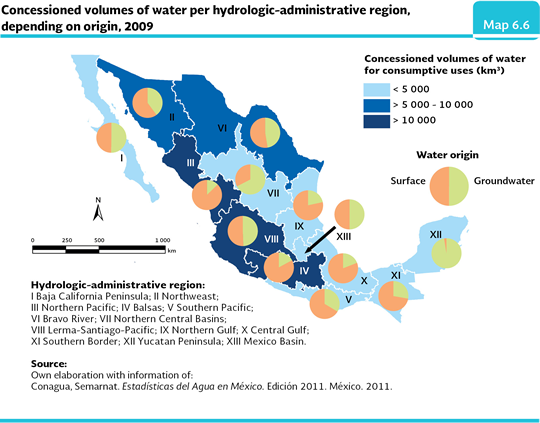
From the total volume of water allocated in the country in 2010, almost 56% (44.6 km3) corresponded to the regions Lerma-Santiago-Pacific (14.6 km3, 18%), Balsas (10.4 km3, 12.9%), Northern Pacific (10.4 km3, 13%) and Bravo River (9.3 km3, 11.6%); the regions that extracted less water were Southern Pacific (1.4 km3), Southern Border (2.2 km3) and Yucatan Peninsula which as a whole barely represent 8% of the national total (Map 6.6).
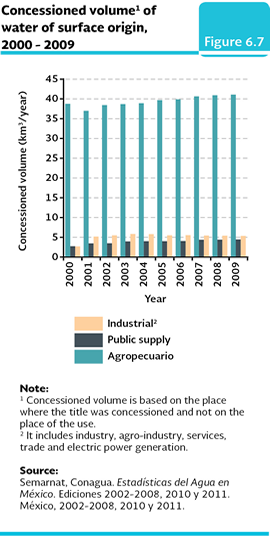
If the origin of the granted water for extraction in the country is analyzed10 in 2009, 63% of the volume came from the surface sources, while the remaining 37%, from the ground sources. The extraction from surface sources has increased a little more than 15% between 2000 and 2009, while the extraction of groundwater remained, practically, without changes (IB 2.1-3). Now, there are important differences within the country in respect to the proportion of surface and groundwater that is used: for instance, in 2009 the regions where the water came from, in the larger extent, surface sources were Northern Pacific (87%), Balsas (83%), Central Gulf (81%) and Northern Gulf (78%), while in the regions of the Northern Central Basins and the Yucatan Peninsula was used an important fraction of water of ground origin (67 and 97%, respectively; Map 6.6; Table D3_AGUA03_03). In 2009, the water supply for agriculture use, as well as the use for industry and the electric power generation at a national level came, mostly, from surface sources (66 and 70%, respectively), in contrast to the water that is assigned for public use, which mostly came from ground sources (62%). Between 2000 and 2009 the granted water volume for agricultural use with a surface origin raised 6% in the period (going from 38.58 to 40.92 cubic kilometers); on the other hand, the use of surface water for the public supply increased 66.7% (it moved from 2.58 to 4.32 cubic kilometers), while in the same period the industrial use of surface water was two score (moved from 2.54 to 5.20 cubic kilometers; Figure 6.7; Table D3_AGUA03_03).
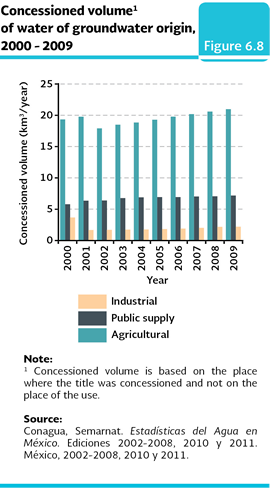
Concerning the granted water volume of ground origin, between 2000 and 2009 increased 8.5% for the agricultural use (changed from 19.22 to 20.87 cubic kilometers), with some fluctuations though; in the same period, the volume of granted water for public supply with the same origin increased 24.1% (moved from 5.71 to 7.09 cubic kilometers), in contrast to the ground volume for industrial use which decreased 41.4%, because it moved from 3.58 to 2.1 cubic kilometers (Figure 6.8).
If the consumption uses of the water are analyzed per region, the differences become important. In 2010, in the Northern Pacific region, 93% of the water was used for agricultural activities, while in the Valle de Mexico region; this consumption use hardly reached 49.5% (Map 6.7, Table D3_AGUA03_03). Concerning the water for public supply, the regions that proportionally assigned more water were Mexico Basin (44.9%), Yucatan Peninsula (20.7%), Southern Pacific (24.4%) and Southern Border (21.1%). The water assigned for industrial use, in general, is below the use for public supply, but in the regions Balsas, Central Gulf and Yucatan peninsula (with 32.7, 22.8 and 18.5%, respectively).
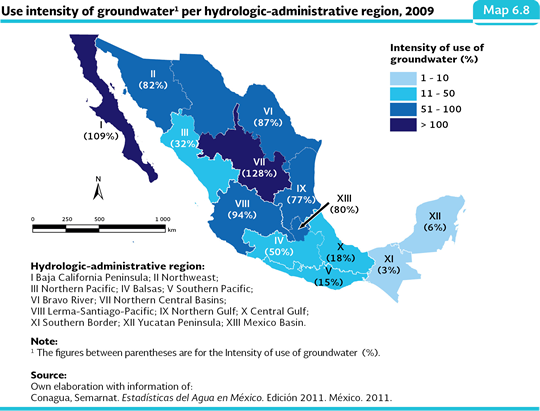
Groundwater: use intensity and overexploited aquifers A good indicator to know how the consumption uses affect the sustainability of the ground resources is the intensity use that is calculated as the ratio of the groundwater extraction times the average recharge of aquifers. If it is analyzed per hydrological-administrative region, the overview is disturbing: in 2009, the use intensity values of the groundwater in the regions Central Basins in the North and the Baja California peninsula were very high, it means, the used water surpassed the recharge, with values at 110%, respectively (Map 6.8; Table D3_AGUA02_01; IC 10). On the other hand, between 2004 and 2009, for the regions Northern Gulf and Northweast, the intensity use decreased 37 and 17%, respectively.
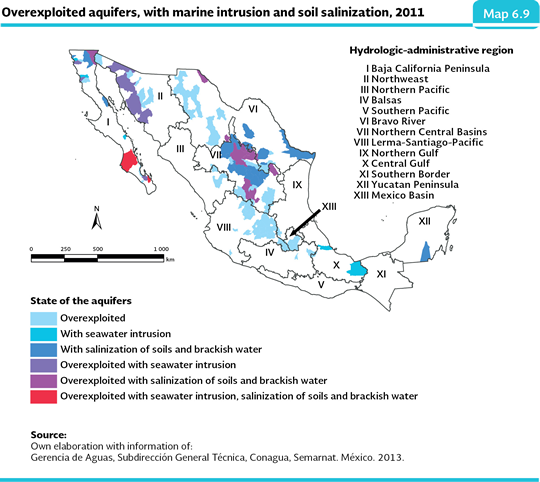
One of the most important aspects of the proper management of the groundwater lies in the volume control used by the different consumption users. Sometimes, the demand may be very intense, and since some aquifers have very long renovation periods, the demand may surpass the recharge of the aquifer and produce its overexploitation. Since the 1970’s decade, the number of overexploited aquifers has highly increased. In 1975 there were 32 aquifers in this category, figure that increased to 36 in 1981, 80 in 1985, 100 in 2009 and 102 in 2011. The 102 overexploited aquifers represent 15% of the 653 there are in the country. The overexploited aquifers are located in the hydrological regions Lerma-Santiago-Pacific, Northern Central Basins, Bravo River, Northweast and Baja California Peninsula (Map 6.9). The 58% of all-use-groundwater is extracted from these aquifers.
In addition to the overexploitation, some aquifers are located under salinization conditions. In wide irrigation areas, especially in the ones located in the coastal areas, the overexploitation of the aquifers has caused the groundwater levels have decreased several meters which favors the intrusion of sea water and the decrease of the quality of their water. In 2011, fourteen aquifers had problems of saline intrusion (eight of them had overexploitation conditions, mainly the ones in the Baja California peninsula and Northweast regions) and 31 showed salinization problems and brackish groundwater (13 of them in overexploitation condition; IB 2.1-7). See the Box Future scenarios of water availability.
Notes: 2 It refers to the average natural availability that corresponds to the total volume of surface and ground renewable waters that occurs in a natural way in a region.
|