| CHAPTER 5. ATMOSPHERE |
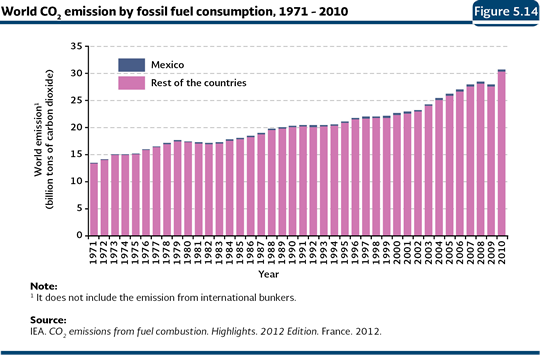
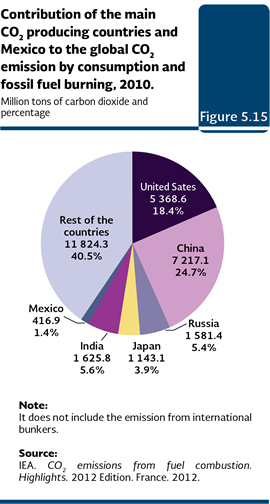
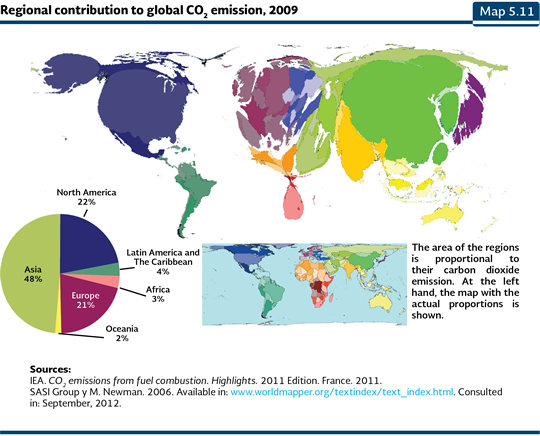
CLIMATE CHANGE The climate change is one of the main global challenges in this time, with implications that go beyond the environment, because its projected effects could have important economic, social and political consequences which will determine, at a large extent, the characteristics and conditions of the economic development in this century (Semarnat and SHCP, 2009). While it has been a much commented issue, it is not understood in the same way, since there are wrong interpretations where the tendency has been to consider it as the responsible phenomenon of events with which it has little or not a relationship at all. In order to understand this phenomenon, it is necessary to know, in the most objective way and based on solid information sources, both the scientific bases of the problem and the reasons and possible effects that it brings about. In this context, this section describes in a general way the phenomenon of the climate change, its causes and consequences, as well as the taken mitigation and adaptation measures. The atmosphere is naturally constituted primarily by nitrogen and oxygen that jointly account for 99.3% of the gases that constitute it. The argon represents 0.93% of the total and the remaining percentage is composed by other gases in lower concentrations -carbon dioxide (CO2), water steam, ozone (O3), methane (CH4) and nitrous oxide (N2O)–, which, due their capacity to absorb heat, are called greenhouse effect gases (GHG). The climate, and particularly the temperature of the surface of the earth, depends on the balance between the solar energy received by the planet and the heat (infrared radiation) it emits. The GHG let the radiation go through the atmosphere almost freely, but they absorb the infrared radiation emitted by the surface, and they even radiate again a part of heat towards it, making a net warming effect, in a similar way to what happens in greenhouses. Without this phenomenon, the temperature of the Earth would be, in average, 33°C colder (IPCC, 2001) and very likely, the life would have not been developed or it would be very different from the life we know nowadays. The climate is a very complex phenomenon that is far from being steady, because, although there are long term tendencies, there are also natural variations which are manifested in shorter intervals. The Intergovernmental Panel on Climate Change (IPCC) defined the climate change as “… any change in the climate over time, either because of the natural variability or as result of human activities” (IPCC, 2007a). Although there are several factors that may affect the climate, the IPCC concluded in its 2007 Fourth Assessment Report that the increase of the average temperature observed since the middle of the 20thcentury until today, it is caused very likely9 due to the increase of the GHG concentrations of anthropogenic origin (IPCC, 2007a). Anthropogenic GHG emissions The greenhouse gases are emitted by both natural sources and by human activities, within them, the most important one is the burning of fossil fuels. Since the Industrial Revolution started in the 18th century, the production of goods and services was greatly intensified, which brought a large demand and consumption of fossil fuels that generated growing emissions of GHG that, when they are incorporated into the atmosphere, increased their concentration and, according to the available scientific evidence, have promoted the global warming and the climatic change (IPCC, 2007c). The CO2 is the most important GHG in terms of its volume, its long life in the atmosphere (between 5 and 200 years), its radiative forcing10 (1.3-1.5 Wm-2) and the outstanding increase of its concentration in the atmosphere (IPCC, 2001). This gas has been assigned a warming potential of 1 and it is used as a reference to set the potential of the rest of the GHG (IPCC, 2001; NAS, 2001). World emissions Since the volume of the global emission of CO2 is representative of the GHG total, because it is equivalent to more than 70% of the total emissions and because is the GHG for which there are more reliable and homogeneous information at a world level, this section will just make reference of this gas emissions for consumption or burning of fossil fuels as an approximation to the total GHG emissions. It is important to note that although most of the countries which make up the United Nations Framework Convention on Climate Change have a first National Inventory of GHG Emissions, the information is about different periods, therefore, they are not fully comparable11. The CO2 emission has been directly raised due to the burning of fossil fuels. During the period 1971-2010, the world emission derived from the fossil burning increased about 115% (Figure 5.14; IB 1.2-1). According to the last report published by the International Energy Agency, in 2010, five countries were responsible of 58% of the emitted CO2 at a worldwide level for consumption and burning of fossil fuels: the United States, China, Russia, Japan and India, which, as a whole, emitted 16,935.9 million tonnes out of a total of a little more than 30.2 billion tonnes generated in the planet (Figure 5.15). Among those countries, China and the United States stand out, responsible of 24.7 and 18.4% of the emissions in the planet in that year, respectively. The contribution of Mexico to the global emissions in 2010 was 1.4%, placing it among the first fifteen countries based on their emission volume (Figures 5.14 and 5.15). If the emission of carbon dioxide is considered within the regional context Asia, North America and Europe stand out (Map 5.11).
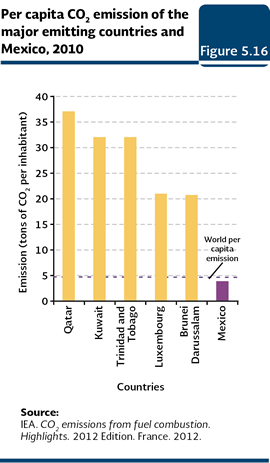
If the worldwide emissions per capita in 2010 are examined, the countries that stand out are Qatar (36.9 tonnes of CO2 per inhabitant), Kuwait (31.9), Trinidad and Tobago (31.9), Luxembourg (21) and Brunei Darussalam (20.6); these countries are the five principal emitters, with volumes that were the equivalent between 4 and 8 times the emission per capita at a world level (4.44 tonnes of CO2 per inhabitant; Figure 5.16; IEA, 2012). In the case of Mexico, the value may be different, depending on the information source, between 3.63 (INE, Semarnat, 2012) and 3.85 tonnes of CO2 per inhabitant (IEA, 2012). These figures place it in the 70th place in the world and as the second lowest within the countries of the OCDE (10.1 tonnes per person), a long way below Luxembourg, United States (17.31) and Australia (17; IEA, 2012).
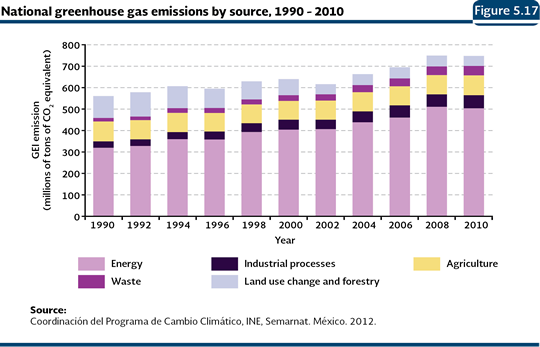
National emissions In Mexico, the first national estimation of GHG emissions was published in 1995 with data from 1990. These data were presented to the 1997 United Nations Framework Convention on Climate Change as part of Mexico’s First National Communication to the Convention. Later, in the Second National Communication (2001) the emissions for 1994, 1996 and 1998 were calculated using the 1996 IPCC revised methodology. In 2006, it was presented the Third National Communication which included the national inventory with new calculations for the period 1990-2002. In 2009, it was presented the Fourth National Communication with information for the period 1990-2006 and by the end of 2012 it was published the Fifth National Communication with information of the period 1990-2010. It is important to note that because of the change of method, the comparisons among inventories are not advisable, that is why this text just mentions the data reported in the last published inventory. According to the last National Inventory of Emissions of Greenhouse Effect (INEGEI in Spanish), the total emissions of GHG increased about 33.4% between 1990 and 2010 being this last year about 748 million tonnes of CO2 equivalent12(Figure 5.17). The energy sector, which includes the consumption of fossil fuels13and the fugitive emissions14, emitted in 2010 a little more than 67% of the total of GHG (503.8 million tonnes of CO2 equivalent; Figure 5.17, IC 7). Within this sector, the consumption of fossil fuels is the principal source of emissions in the country: between 1990 and 2010 it emitted between 48.6 and 56.2%, respectively, of the total volume of GHG.
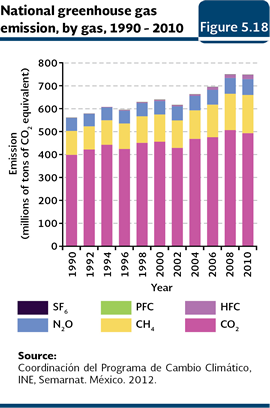
In 2010, the emissions derivated from waste (which includes the disposal of solid waste in the soil, handling and treatment of waste water and waste burning) contributed with 5.9% of the GHG total (44.1 million tonnes of CO2 equivalent), while the agriculture, the industrial processes and the land use, changes in land use or forestry were responsible of 12.3, 8.2 and 6.3% (92.2, 61.2 and 46.9 million tonnes of CO2 equivalent, respectively) of the national total. From the six principal GHG considered by the Kyoto Protocol15, that include CO2, CH4 (methane), N2O (nitrous oxide), HFC (hydrofluorocarbons), PFC (perfluorocarbons) and SF6 (sulfur hexafluoride), the CO2 was the one emitted with a higher frequency at a national level (66% of the total emitted GHG), followed by the methane, with about 22% of the total (Figure 5.18).
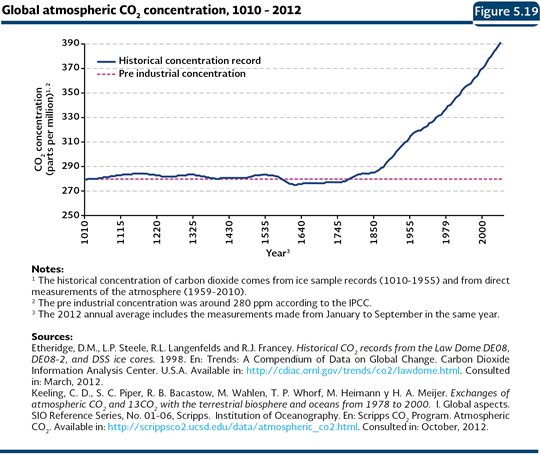
According to the INEGI, between 1990 and 2010, the national emissions of almost all of the greenhouse gases increased, and due to its importance in volume, the CO2 emissions are the ones that stand out since they increased 24%. The CH4 had an increase of 60% and the N2O an increase of 23%. In contrast, the PFC emissions were reduced. Although the HFC and the SF6 show a dramatic growth between 1990 and 2010 (2,307 and 320%, respectively), it must be considered that their emission volumes are very little compared to the remaining gases. There are other greenhouse gases that, in spite of being emitted in a much lower volume than the CO2, contribute in a meaningful way to the global warming due to their combined action of time of permanence in the atmosphere and from heat retention. For instance, the chlorofluorocarbons (CFC) that destroy the stratospheric ozone layer may remain in the atmosphere up to 1,700 years, while the fluorocarbons may remain there up to 50 thousand years. Concerning their heat retention, the halocarbons, that include the halons and CFC, have a radiative forcing of 0.33 Wm-2 that is equivalent to 13% of the radiative forcing of all of the GHG globally mixed (IPCC, 2007a). In the international context, if the CO2 emission is examined with the reference to the Gross Domestic Product (GDP) of the country, Mexico (0.55 kg of CO2 per dollar with the price in 2000) took in 2009 the 23rd global place within the countries of the Organisation for Economic Cooperation and Development (OECD), after Greece, New Zealand and the United States, among others (IEA, 2011). At a worldwide level, our country is placed in the 53rd place, with a value below the world average of 0.73 kg. of CO2 per dollar considering the price in 2000. The intensity of the emissions in Mexico has steadily decreased since the late eighties, when its value reached 0.64 kg. of CO2 per dollar 2000 prices, which means a tendency towards a lower intensity of carbon in the economy. Concentration of greenhouse gases in the atmosphere The accumulation of CO2 in the atmosphere is caused due to the natural sinks, such as the vegetation and the water bodies, have not been enough to catch their growing emissions, what has brought as a consequence the increase of its concentration in the atmosphere. Since the CO2 is easily dispersed, the measures made in any part of the planet are representative of the global situation. Notwithstanding, the longest and most reliable historical record is from the Mauna Loa area, in Hawaii, therefore, the information gathered in this place is considered as representative of the temporary dynamics of the global concentration (Keeling and Whorf, 2005). The information of the CO2 concentration is complemented with the information gathered by the paleoclimatologists who have described the past climate, from ice samples known as “ice cores”, which have bubbles with a fraction of the atmosphere from the age when they were formed. From these samples, the temperature and the gas concentration, among other variables, may be estimated. According to the historical records and the estimates from the “ice cores”, the atmospheric concentration of CO2 remained, relatively steady, increasing in a clear way during the second half of the 20th century and reaching a very marked acceleration during the second half of the 18th (Figure 5.19; IB 1.2-4). While the CO2 preindustrial concentration was about 280 parts per million (ppm), in 2012 it reached 394 ppm, which means an increase of a little more than 40%.
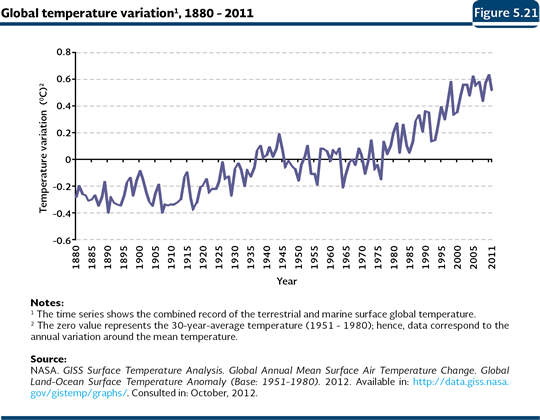
In general terms, it has been estimated that the CO2 is responsible of about 60% of the greenhouse effect accumulated since the 18th century, the CH4 is responsible of the 20%, the N2O is responsible of 6% and the halocarbons are responsible of 14% (PNUMA, 2002; IPCC, 2007a). The radiative forcing of CO2 increased 20% from 1995 to 2005, which represents the biggest change per decade in the last 200 years (IPCC, 2007a). According to the last IPCC evaluation, the combined radiative forcing, due to the increase of CO2, CH4 and N2O is 2.30 Wm-2 and its increase rate throughout the industrial age is very likely it does not have a precedent in the last 10 thousand years. Evidence and consequences of climate change Temperature The evidence of climate changes, both at a global and regional level, basically include temperature increases (atmospheric and sea surface), in the concentration of water steam in the atmosphere, as well as the changes in the precipitation, wind patterns and the atmospheric and oceanic circulation patterns (the latter ones are manifested in a higher frequency, persistence and intensity of the phenomena of the El Niño-Southern Oscillation; NAS, 2001; IPCC, 2007c). The temperature increase (known as the “global warming”) is one of the strongest evidences of the existence of climate change. The World Meteorological Organization (WMO) stated that the 13 hottest years since there are temperature records were concentrated in the last 15 years (OMM, 2011). According to the IPCC, the temperature increase of the period 2001-2005 with respect to the period 1850-1899 was 0.76°C (IPCC, 2007a). The global temperature records, in the last ten years, show the average variation was nearly 0.55°C over the media of the period 1951-1980; 2010 was the year where the highest deviation was held (0.63°C; Figure 5.21; IB 1.2-5).
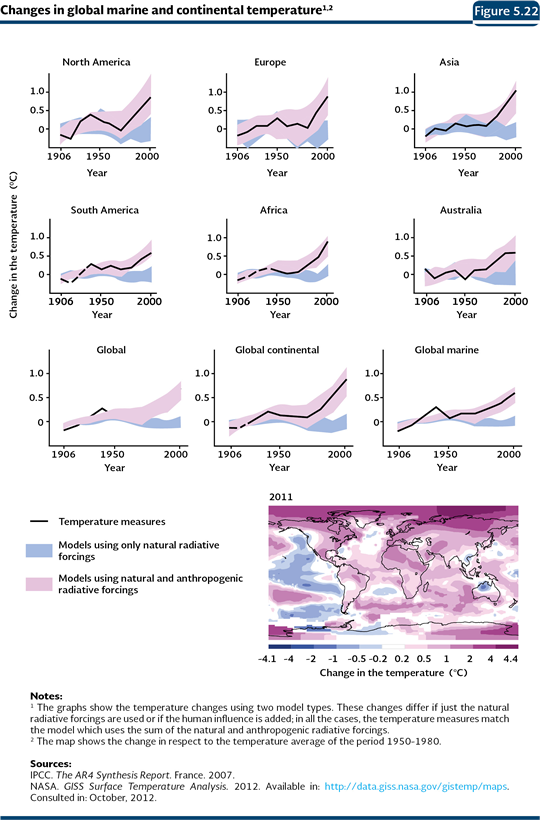
The increase of the temperature has not been similar in all regions. The IPCC evaluation (2007) shows the temperature increase has been higher in the northern hemisphere; the growth rate of the average temperature in the Arctic was almost two folded than the recorded rate at a global level in the last 100 years. On the other hand, the terrestrial regions have warmed faster than the oceans have, being more accelerated in Europe, North America and Asia (Figure 5.22).
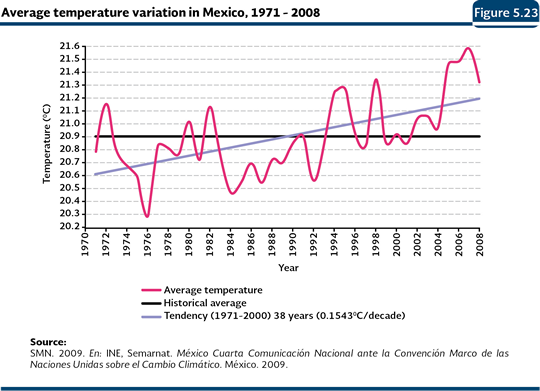
In the case of Mexico, the instrumental records from the period 1971-2008 show an increase in the annual average temperature of 0.6°C in average (Figure 5.23). The historical media of that period was 20.9°C and since 1990 most of the recorded annual average temperatures have been over that value. In the period 1999-2008, the warming has been of 0.7°C (INE, Semarnat, 2009).
The observed warming at a national and global level is related to the increase, in the mid-latitudes, to the amount of extreme warm days, to the decrease in the amount of extreme icy days and to the decrease of the number of frosts (IPCC, 2007c). The records prove the heat waves in the world increase in frequency and length. For instance, in the summer of 2003, Eastern and Central Europe faced an intense heat wave that caused the death of 35 thousand people. That summer was the recorded warmest one since 1780 in that continent. The global warming has also brought important changes in the biodiversity (see Box Effects of the climate change on biodiversity).
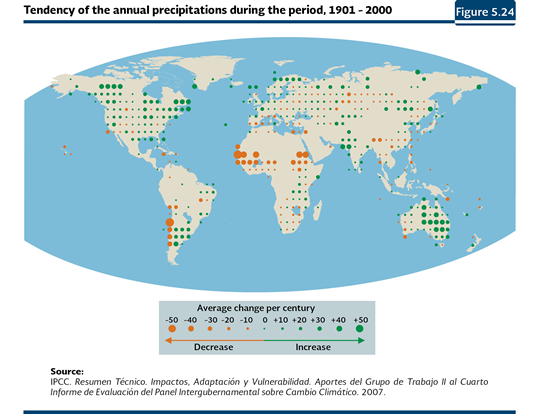
Precipitation According to the IPCC, from 1976 the surface humidity increased very closely related to the highest terrestrial and oceanic temperatures. The total water steam in the air, over the oceans, increased 1.2% per decade since 1988 until 2004, which could be shown in the increase of precipitations in the form of rain and snow (IPCC, 2007c). It has been observed a meaningful increase in the precipitations in western areas of North and South America, Northern Europe and Northern and Central Asia, as well as drier conditions in the Mediterranean, Southern Africa and some areas of Southern Asia (Figure 5.24; IPCC, 2007c and 2008).
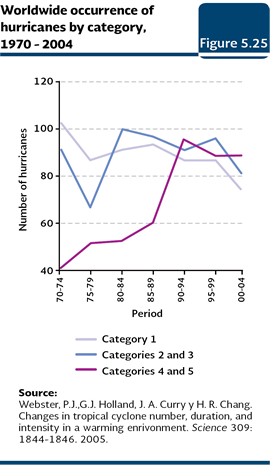
Although, the precipitations have increased in many regions of the planet, they have also done it in the drought areas, as well as their length and intensity. Most of the studies that measure the drought use the changes in the precipitations joined to the temperature, as it is the case of the Palme Drought Severity Index (PDSI). Based on this index, the IPCC shows that it has recorded more intense and longer droughts in the tropics and the sub tropics since 1970 (IPCC, 2007c). These changes are caused by the intensification of the lack of humidity because of higher temperatures and to the decrease of the precipitations (see Box Extreme meteorological phenomena: the drought case in the chapter Water and the section The desertification problem in the chapter Soils) Hurricanes The effect the temperature has on the cyclonic activity is a controversial issue. As of today, a clear relationship between the temperature and the number of hurricanes has not been found; however, every time, there seems to be more evidence that the intensity of the hurricanes has indeed been influenced by the growing temperature of the oceans. At a global level, the number of hurricanes of category 116 has been relatively steady. In contrast, the hurricanes of the stronger categories (4 and 5) practically doubled their number and proportion in respect to the total number of hurricanes recorded during the last decade (Figure 5.25; Webster et al., 2005). Projections for 2100 indicate consistently that the increase in temperature will increase the average intensity of tropical cyclones between 2 and 11% (Bender et al., 2010; Knutson et al., 2010).
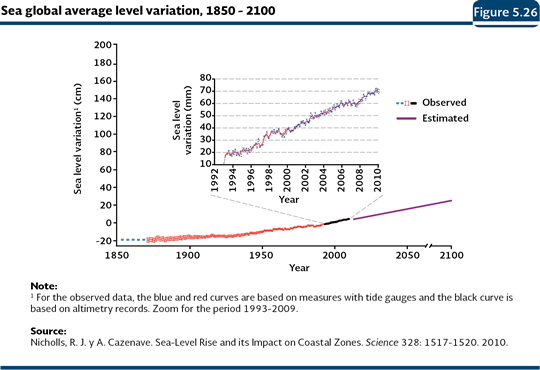
Sea level The increase of the sea level is caused by two main factors: the expansion of the marine water bodies due to their warming and the contribution of water that melts from glaciers. Regarding the first factor, the oceans have absorbed around 80% of the heat that has been added to the climate system (IPCC, 2007c). Their thermal expansion increased dramatically since the second half of the 20th century and contributed with about 25% of the sea level increase from 1960, while for the 1993-2003 period, it did it in about 50% (Nicholls and Cazenave, 2010). However, it is important to note that the temperature increase of the sea has not been done in the whole planet; areas from the North Atlantic, North Pacific and equatorial Pacific got colder the last 50 years, following an opposing pattern to the global tendency of warming (IPCC, 2007c). The total increase of the average sea level for the 20th century has been estimated in 17 centimeters, with a range between 12 and 22 (IPCC, 2007a). The world average of the sea level was, in the 1961-2003 period, 1.8 millimeters per year (with a range of 1.3 and 2.3 mm; Figure 5.26). However, between 1993 and 2003, the average increase rate reached 3.1 millimeters (2.4 to 3.8 mm) per year (IPCC, 2007a; Nicholls and Cazenave, 2010). Perhaps this increase seems minimal, but if it is considered there are several cities located in low coastal areas and even below the sea level (just as Amsterdam, Netherlands, which is, in average, 4 meters below the sea level), small changes in the level may have important effects.
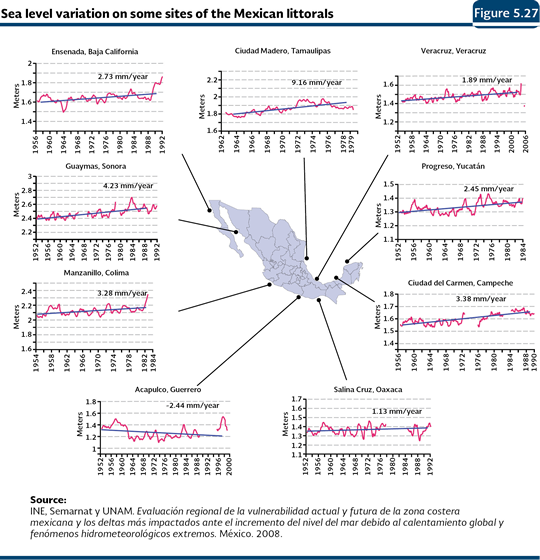
On the other hand, the melting of the glaciers contributed with about 30% of the sea level increase from 1993 to 2009 (Nicholls and Cazenave, 2010). According to the IPCC, the melting of the glaciers and polar caps contributed with 0.05 meters to the increase of the sea level in the 1961-2003 period and with 0.077 between 1993 and 2003 (IPCC, 2007c). Mexico has also been affected by the sea level increase. The records show that most of the 17 places studied in the Gulf of Mexico and the Mexican Pacific, between the beginning of the 1950s and 2000, show increase tendencies in the level, but Acapulco, Guerrero, whose tendency was negative due to a movement in the crust of the earth caused by a double earthquake (Semarnat et al., 2008). The Figure 5.27 shows the tendency of the sea level in some of the 17 analyzed sites. In the Gulf of Mexico, the recorded increase moved from 1.79 millimeters per year in Alvarado, Veracruz, to 9.16 millimeters in Ciudad Madero, Tamaulipas; however, it must be considered that the periods with data for both places are different. In the Mexican Pacific, Guaymas (Sonora) and Manzanillo (Colima) are outstanding due to their annual increases of 4.23 and 3.28 millimeters, respectively (Semarnat et al., 2008).
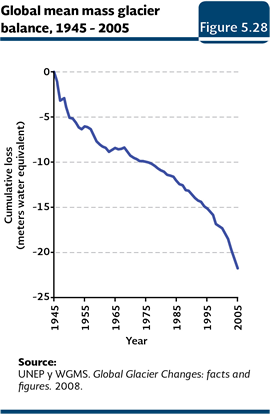
Meltings The glaciers and polar caps that currently cover about 10% of the terrestrial surface of the planet suffered a great mass loss and contributed to the increase of the sea level during the 20th century (UNEP and WGMS, 2008). According to the United Nations Development Program (UNEP) and with the World Glacier Monitoring System (WGMS) the global balance of the average mass of the glaciers was negative in the last six decades, meaning that the ice volume loss was larger than the accumulated volume. The accumulated loss of the ice thickness in 2005 was about 15 meters of equivalent water (mwe)17 compared to the loss in 1980 (Figure 5.28; UNEP and WGMS, 2008).
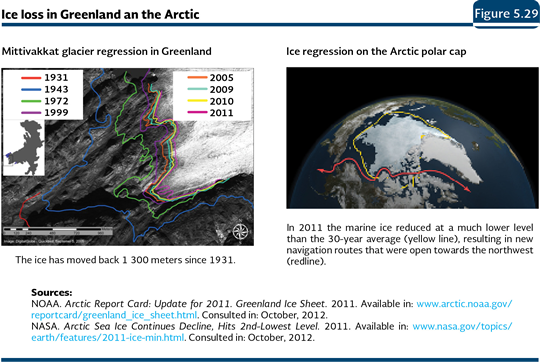
On the other hand, the measures of the length of some of the glaciers in the world have been available since the end of the 19th century, what shows a general setback in respect to its size in the Little Ice Age, which was from the beginning of the 14th century until mid-19th century (UNEP and WGMS, 2008). According to a NASA study, the Greenland and Antarctic ice layers are losing mass at a very accelerated rate: in 2006, each one of those ice layers lost, in average, a mass of 475 gigatonnes18, which would be enough to increase the sea level 1.3 millimeters per year. In 2011, the Greenland melting was about 430 gigatonnes, in other words, the third most important melting recorded in the world since 1979 (NOAA, 2011b). The Figure 5.29 shows the setback of the Mittivakkat glacier, in the southeast of Greenland, in the 1931-2001 period. The glacier limit has retreated about 1,600 meters in total since 1900 and 1,300 meters since 1931 (NOAA, 2011a). The same figure shows the reduction of the ice expansion in the Arctic polar cap: in September 2011, it reached the second lowest recorded level (4.61 square kilometers) in respect to the average of thirty years recorded between 1970 and 2000 (7.04 million of square kilometers; NASA, 2011).
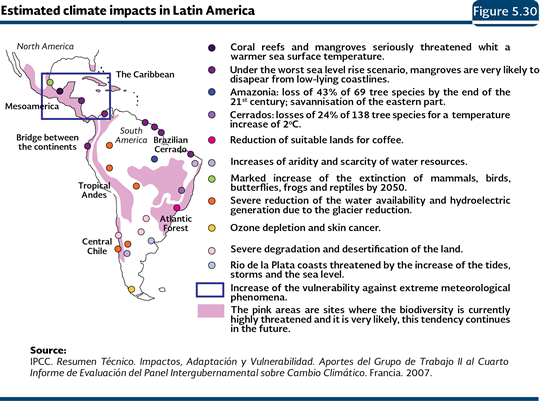
The melting has also affected the mountain glaciers: in 2006, they lost 402 gigatonnes per year in average (NASA, 2011). The Swiss Alps glaciers, in the 1850-1980 period, lost a third of their surface and at least half their mass, and the tendency continues, by 2050, the 75% of them will have disappeared (EEA, 2004). In Latin America, for the next 15 years, it is very likely the intertropical glaciers disappear (IPCC, 2007c). In the particular case of Mexico, the glaciers in the Iztaccíhuatl had reductions of up to 40% of their extension between 1960 and 1983, while the Pico de Orizaba and the Popocatepetl showed a similar tendency (although the latter showed an accelerated reduction cause by the volcanic activity). If such reduction rates remain steady in the case of the Mexican glaciers, it is likely they will completely disappear in less than 30 years (Delgado, 2007; Delgado et al., 2007). The consequences of the meltings are not just observed in the increase of the sea level. Over a sixth of the world population, which lives in river basins fed by the glaciers or by the melted snow, will be affected as the water availability lowers as well as the hydroelectric power due to the decrease in the extension of the glaciers and the snow (IPCC, 2007c). The climate of the future and its consequences Future global impacts The great amount of factors that take part when determining the climate make the task to project the climate of the future complex and difficult. In spite of the related uncertainty, the most conservative scenarios with climate change, project serious consequences over aspects so important for the social well-being, for instance, the human health, the ecosystems and the availability of water resources, what has promoted that at a global level, serious actions are taken to avoid that the human activities alter even more the climate of the planet. According to the IPCC, the CO2 concentration in 2100 could be between 540 and 970 ppm, a lot over the 280 ppm recorded in the period 1000-1750 and between 1.4 and 2.5 times over the current concentration (392 ppm). As a consequence of the concentration estimated for 2100, the increase in the average temperature could be between 1.8 and 4°C by the end of this century. If the uncertainty related to the different scenarios of the modeled emissions is taken into consideration, the temperature could vary from 1.1 to 6.4°C. It is important to note that such warming will be differential, higher over the terrestrial surface and in boreal latitudes, and lower over the Antarctic Ocean and in the north of the Atlantic, estimating its increase of 0.2°C per decade in the next twenty years. For Latin America, it has been estimated an increase in the temperature between 1 and 6°C by the end of the 21st century, as well as disorders in the precipitation with increases in the tropical areas and decreases in the south. The temperature increase could bring along, that by the end of the 21st century, the marine ice of the Arctic, practically disappears during the summer. The estimations at a global level indicate that by the end of the current century, as a consequence of the ice melting, the average sea level will increase between 18 and 59 centimeters, with important regional variation though (IPCC, 2007a). It is also estimated that the melting of the ice layer of Greenland continues contributing to the elevation of the sea level, at least until 2100 (IPCC, 2007a). In some regions of the planet, it is likely that the tropical cyclones become more intense, with a larger amount of rain and wind speed and the heat waves become more frequent (IPCC, 2007a). The precipitation will increase, very likely, in high latitudes, while in sub-tropical regions they will decrease up to 20% towards 2100 (IPCC, 2007a). It is also likely that the frequency and intensity of the hurricanes in the Caribbean increase, as well as the occurrence of meteorological and extreme climate phenomena (Figure 5.30; IPCC, 2007c).
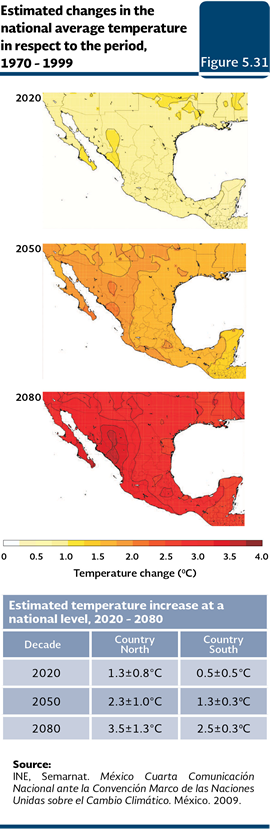
Regarding the biodiversity, it has been stated, for instance, the reduction and even the loss of the populations of several species and ecosystems; higher rates of coral reef bleaching; the reduction or expansion of the distribution areas of several species of invertebrates, fish, insects, birds and plants; making several species of plants to flower earlier and the early arrival and reproduction of migratory birds. The scientists have estimated the tropical forests may gradually turn into savannahs by the middle of this century in the east of the Amazon and in the sub-tropical forests of central and southern Mexico. They also estimate the semi-arid vegetation become arid in the north of Brazil and in a large part of central and northern Mexico due to the temperature increase and to the decrease of water in the soil. It is very likely that in 2050, 50% of the farming lands face desertification and salinization. Besides, there may be a meaningful loss of biodiversity due to the extinction of species in many tropical areas in Latin America (IPCC, 2007c). Regarding the social matters, it has been estimated there may be an increase in the number of deaths of people in the world because of the heat waves and diseases such as the malaria and the dengue may become a world public health problem since the distribution area of their vectors could expand (IPCC, 2001; NAS, 2001; Townsend et al., 2002; CBD, 2003; Smith et al., 2003). Future impacts in Mexico There are several estimates about the effects the climate change could have in Mexico for different sectors. This text will discuss some of them and it is recommended to consult, for deeper information, the specific studies or the Fourth National Communication presented at the United Nations Framework Convention on Climate Change. In the Fourth Communication there are estimates about the fishing, forestal, agricultural, livestock, touristic and human health sectors. According to the Fourth National Communication, the scenario19 for which the major changes in temperature are estimated, projects the most important will occur in the northeast of Mexico and the area of the Gulf of California, while in the southeast, the lowest increases are expected (Figure 5.31; INE, Semarnat, 2009).
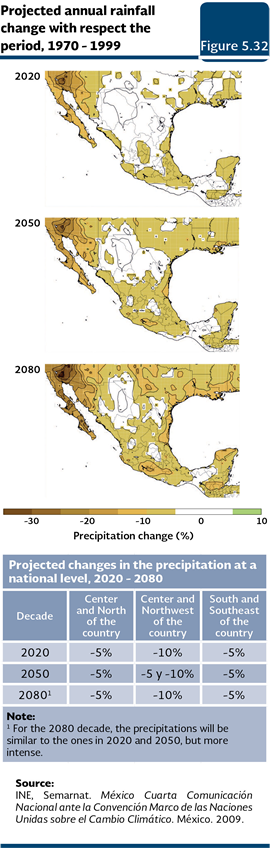
In reference to the precipitations in this same scenario, the estimates show that, towards the mid and the end of the current century, the rains will decrease in most of the areas in the country (Figure 5.32), being the area in the northeast of Mexico, in the high area of the Gulf of California, the most affected. The annual national average of precipitation could decrease between 11 and 30% in the northeast by the end of this (INE, Semarnat, 2009).
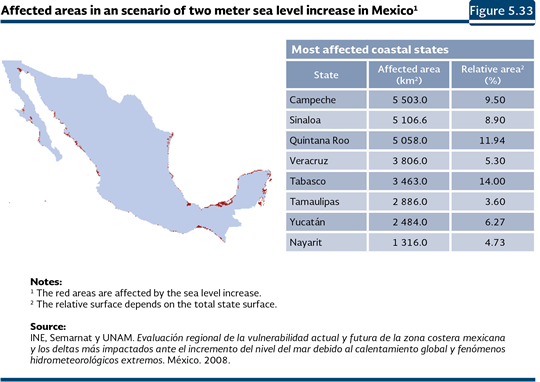
The sea level increase could affect the coastal environments causing floods, wetland losses, erosion, salt water intrusion in the aquifers and a raise in the phreatic level. A study about vulnerability of the Mexican coastal areas against the sea level increase came up with estimates about the damages in Mexico under three scenarios of sea level increase: 0.6, 1 and 2 meters (INE, Semarnat y UNAM, 2008). In case of a 2 meter increase, the national affected surface would be 29,622.6 square kilometers, being Campeche, Sinaloa and Quintana Roo the most affected ones in absolute terms. In terms related to their surface, Tabasco (14%) would be the most affected one, followed by Quintana Roo (11.9%), Campeche (9.5%) and Sinaloa (8.9%; Figure 5.33). In the case of the lowest increase of sea level (0.6 m), the most affected states would be Tabasco (21.2% of its surface), Campeche (13.3%) and Sinaloa (9.5%).
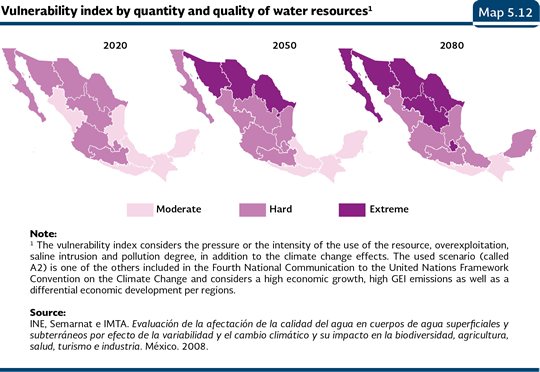
Concerning the water resources of the country, these may be seriously affected by the climate change. A study made by the Mexican Institute of Water Technology (IMTA) evaluated the variation of the availability of water in the country, concluding that given that currently, the amount and quality of water are vulnerable20, the vulnerability will grow under conditions of climate change, being the most affected hydrological-administrative areas the Northeast and the Rio Bravo ones, followed by the Central Basins of the North, Baja California and Valley of Mexico (Map 5.12; INE, Semarnat and IMTA 2008).
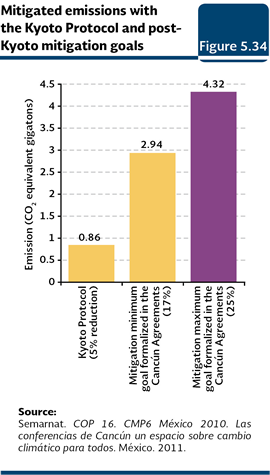
About the effects on the national biodiversity and in the particular case of the ecosystems, the estimates made in a study by the National Institute of Ecology (2009) show that the most notorious changes will be observed in the north of the country, with potential reductions in the surface of the conifer forests. It also estimated that with an elevation of one meter above the sea level, wetland surface will be lost in the coasts of the South Pacific, in the Peninsula of Baja California, the Caribbean and the Gulf of Mexico. The same study suggests that the increase in the intensity of the hurricanes will cause a higher erosion in the beaches and dunes in the Riviera Maya in Quintana Roo; here the effects are being noted now in some areas of the mangroves which have been left exposed to the direct erosion caused by the water waves. At the level of taxonomic group, the INE work foresees that by the mid of the current century, 30 out of the 61 species of mammals considered in the study lose 50% or more of their current distribution area and that, at least for nine of them, it reduces in over 80%. Measures to face the climate change As an answer to this world problem, in the Summit of the Earth in Rio de Janeiro in 1992, the United Nations Framework Convention on Climate Change (UNFCCC), whose objective is to achieve the stability of the GHG concentrations in the atmosphere at a level that minimize the anthropogenic interferences that are dangerous for the climate system. Mexico signed and ratified this agreement in 1992 and 1993, respectively (UNEP, 2002; PEF, 2009). As an instrument of the UNFCCC, the Kyoto Protocol came about in 1997, which established, as an obligation, for the developed countries and the transition economies (which are part of the Annex I) the 5% reduction of their GHG emissions taking as a basis their emissions in 1990 for the period between 2008 and 2012. For the developing countries, the Protocol did not establish measurable objectives for the GHG emission reduction, but it actually established particular commitments, among them the elaboration of national inventories of GHG emissions as well as the elaboration of national communications, mitigation studies and adaptation to the climate change. Mexico signed this Protocol in 1997 and it ratified it in 2000 as a non-annexed country (developing countries; CIC, 2007). As of March 2012, 192 countries had ratified, approved or accepted the Protocol, which, as a whole, emit 63% of the total gases of greenhouse effect of the developed countries or with transition economies (UNFCCC, 2012). Some of the countries that emit a large amount of GHG into the atmosphere have refused to ratify the Kyoto Protocol, among them the United States, responsible of about 18% of the global emissions of CO2 in 2009. It is important to note that although the Protocol was established in 1997, it was not but until 2005 that it went into effect, since it was required to be accepted by a group of Annex I countries that, as whole, would have emitted 55% of the GHG in 1990. This figure was reached at the end of 2004, when Russia, responsible of 17.4% of the total emissions of the Annex I countries (at a world level contributes with 6%), ratified its adherence to the Protocol. Since the Protocol states reduction commitments for the 2008-2012 period, there have been negotiations to provide continuity at the end of its validity, having been accepted in the COP 17 in Durban South Africa, in 2011, a second period of commitments with a length which has not been defined, but it could be set up to 2018 or 2020. In the Conference of the Parts held in 2010 in Cancún, Mexico, the mitigation commitments of the developed countries were formalized. The expected reductions are higher than the ones included in the Kyoto Protocol; in the case of the developed countries, for 2020, the reductions are below their emissions in 1990 (Figure 5.34; Semarnat, 2011).
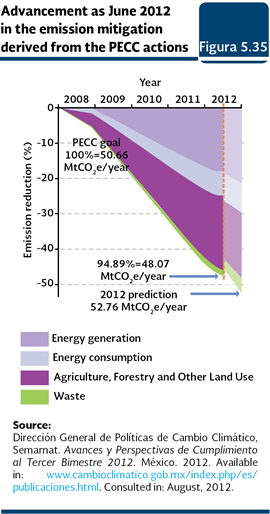
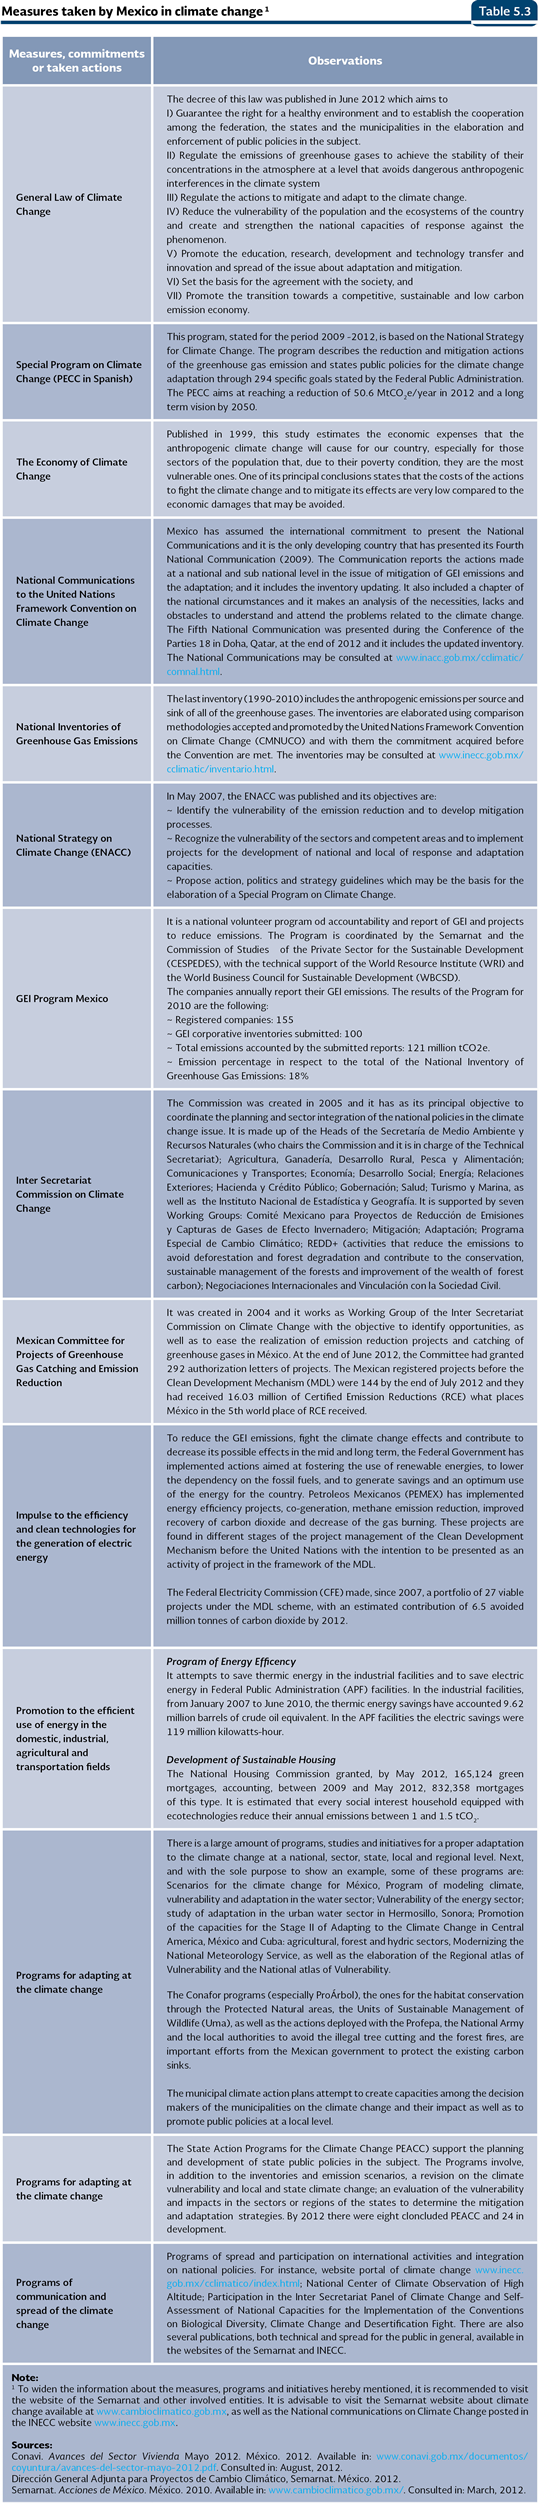
In the framework of these international agreements, Mexico has promoted different mitigation measures and adaptation to the climate change. The country has stood out at an international level as one of the countries that makes important efforts to face this problem. The promotion to establish, at a global level, the Climate Green Fund, as a financial instrument of the Convention, stands out because it supports the adaptation and mitigation actions of the developing countries (Semarnat, 2011), and the elaboration of the Special Program on Climate Change (PECC) 2009-2012. As a result of the objectives established in the PECC, by June 2012, they have been reduced 48.07 MtCO2e/year at a national level, which is equivalent to 94.89% of advance of the 2012 (50.66 MtCO2e/year; Figure 5.35). Some other of the measures taken by Mexico on climate change issues are presented in the Table 5.3.
According to the Stern Report (Stern review: the economics of climate change), if effective measures are not taken now, the total cost of the climate change impacts could be equivalent to at least 5% of the annual global GDP . It is important to note that if the risks and costs of less optimistic scenarios of climate change are taken into consideration, the estimated cost raises up to 20% of the global GDP. In contrast, if measures to reduce the global GHG emissions are taken, the cost could be around 1% annual of the global GDP (Stern, 2007). Facing this scenario, Mexico presented, in 2009, its own study about the economic implications of the climate change. The study highlights that this global phenomenon will have negative economic consequences for our country “… economic costs of the climate change by 2100 will be at least three times over the costs of mitigating 50% of our emissions. For instance, in one of the considered scenarios, with a discount rate of the annual 4%, it was estimated that the climate impacts reach, in average, the 6.22% of the current GDP, while the costs of mitigating 50% of the emission would be 0.70% and 2.21% of the GDP, at 10 and 30 dollars the tonne of carbon respectively” (Semarnat and SHCP, 2009). This means the costs of doing nothing are higher than the mitigation ones. Notes: 9 According to the IPCC, “very likely” it corresponds to a probability higher than 90%.
|