| CHAPTER 5. ATMOSPHERE |
Throughout its history mankind has looked for the enjoyment of a life with a higher level of well-being and comfort. However, the development it has experienced to reach it has been accompanied with massive consumption of natural and power resources, as well as the generation of a large variety of waste and emissions to the atmosphere which have caused a large environmental degradation. Historically, the waste generated by the human activities has been discharged into the atmosphere with the wrong idea that sooner or later they will degrade or disappear. The result is that currently the footprints of the human activity are evident in practically every place, even in those which are far from the places where that waste is generated. A good example of environmental problems which have implications, both local and global, are the atmospheric ones, from which, the most important ones, due to their effects on the health of the population and the natural ecosystems, are the decrease of the air quality, the phenomenon of global climate change and the reduction of the stratospheric ozone layer. The atmospheric pollution has effects at local, regional and global levels. Several countries like Japan, China and Mexico face, for some time now, problems of air quality in their principal metropolitan areas; in the particular case of Mexico, the Valley of Mexico stands out as the most known and commented one. In addition to the local effects related to the bad air quality on the health of the people, there are also effects at a regional level, such as the affectation of the forests and aquatic ecosystems due to the acid rain or, even, at a world level, such as the climate change and the reduction of the thickness of the stratospheric ozone layer, whose more evident effects are manifested in Antarctic (PNUMA, 2002). Because of this situation, it is fundamental to have reliable and updated information about the most relevant issues related to the atmosphere which allow taking effective actions at a local and global level. In this context, this chapter includes information about the pollutant emissions into the atmosphere in Mexico, the current regulations related to them and a description of the air quality in the cities and the most important urban areas of the country in the last years. There has also been included a section about the global climate change, its evidences and consequences, as well as the measures which have been taken to face it, and finally, a section about the decrease of the thickness of the stratospheric ozone layer. Due to its nature and the world effects, the information related with the climate change and the depletion of the stratospheric ozone layer is not restricted to the situation of Mexico but a global overview is given.
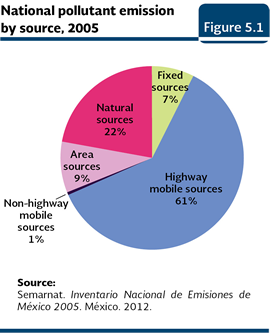
AIR QUALITY Air quality management requires information of two types, standing out the information about the identification of the principal emission generators, the volume and composition of the emissions, as well as the concentration of the pollutants in the atmosphere. This information, which is the base of the programs oriented to improve the air quality, comes, mainly, from the inventories of emissions and from the monitoring networks. Emission inventories The air quality in a specific area, in addition to be affected by climatic and geographic elements, it is directly related to the volume and characteristics of the emitted pollutants, both local and regional, into the atmosphere. So, an indispensable component for the design and application of any program to control the problem of the air pollution is the information about the principal sources of atmospheric pollutants and the emitted volumes. The background of the emission inventories in Mexico goes back to 1988, when the National System of the Inventory of Emissions of Fixed Sources was implemented, as well as the study aimed at quantifying the emissions in the Valley of Mexico Metropolitan Zone (VMMZ). Seven years later it was started a program to increase the capacity of Mexico in the elaboration of emission inventories, which was expanded in 2001 aiming at the elaboration of the National Inventory of Emissions of Mexico (INEM). The development of the INEM had three phases: I) planning, II) development of the inventory for six states in the north and III) the inventories of the remaining states. The results of the second phase were published in 2005 with the data of the Emission Inventory of the States of the Northern Border of Mexico of 1999, which included information about the emissions in Baja California, Coahuila, Chihuahua, Nuevo León, Sonora and Tamaulipas (Semarnat, 2005; INE, Semarnat, 2005). In 2006, the first National Inventory of Emissions was published; such document included information from 1999, broken down by pollutant emission sources and for all of the states and municipalities of the country (INE, Semarnat, 2006). In 2011, the most recent INEM was published with data from 2005, which presents the estimation of the pollutant emissions per source, state and municipality. The information from the INEMs is gathered in the Subsystem of the National Inventory of Emissions into the Atmosphere of Mexico (SINEA). This chapter will focus with more detail on the 2005 INEM results. The information about local inventories elaborated for some metropolitan areas and cities of the country may be consulted directly in their respective Programs to Improve the Air Quality which have been developed. According to the INEM, in 2005 about 71.2 million tonnes of pollutants were emitted, from which, 22% were emitted by natural sources1 and 78% by anthropogenic sources. The natural sources emitted, mainly, volatile organic compounds and nitrous oxides. Although emissions from natural sources were meaningful about volume, they are widely distributed in the entire national territory, in contrast to the anthropogenic ones which become more important because they generate in, or near cities or towns, so the number of people exposed to the harmful effects of the pollutants increases. 89% of the total of the pollutants emitted by natural sources in 2005 corresponded to volatile organic compounds coming from the vegetation and the remaining 11% was of nitrous oxide generated by the microbial activity of the soil. In the case of the anthropogenic sources, the largest emitted volume came from the highway mobile sources (61%), followed by the area sources3 (9%), the fixed sources4 (7%) and the non-highway mobile sources 5 (1%; Figure 5.1; IB 1.1-2; Table D3_AIRE01-01-D).
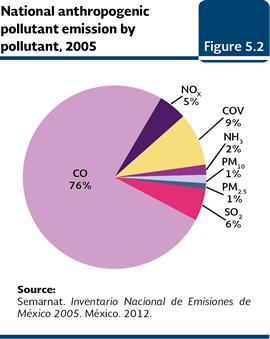
Taking into consideration just the anthropogenic sources, the emitted pollutants in a larger proportion were the carbon monoxide (CO; 41.9 million tonnes; 76% of the total), the volatile organic compounds (COV; 5.2 million tonnes; 9%), the sulphur dioxide (SO2; 3.1 million tonnes; 6%) and nitrogen oxides (NOx, 2.8 million tonnes; 5%). For the rest of the pollutants there was a percentage lower than 2% in each case (Figure 5.2; IB 1.1-2).
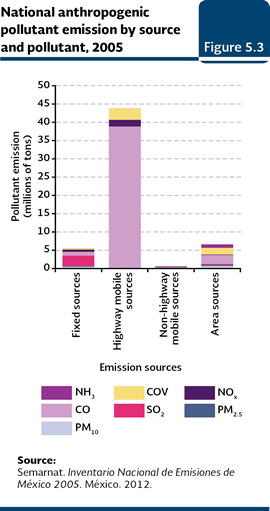
In 2005, most of the anthropogenic emissions were generated by the automotive vehicles (highway mobile sources; 78.3% of the total). These types of sources emitted CO (91.5% of the total CO emitted by all the sources), NOx (66.4%) and COV (59.3%; Figure 5.3). Although with a minor percentage, it must also be mentioned the contribution of the area sources (11.5% of the total of the pollutants from the anthropogenic sources), which produced mainly CO and COV as a result, mainly, from the domestic combustion. They were followed by the fixed sources (9.5% of the total of the pollutants from the anthropogenic sources), which produced the largest part of SO2 in the country (91%), mainly because of the power generation and the oil and petrochemical industry.
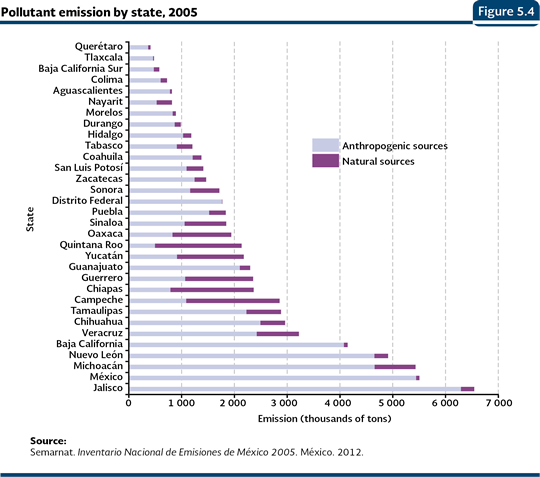
Taking into consideration the emissions from natural and anthropogenic sources, the five states that emitted a larger amount of pollutants were Jalisco, State of Mexico, Michoacán, Nuevo León and Baja California (Figure 5.4). Their contribution to the national total emission was between 5.8 and 9.2%. In contrast, Querétaro, Tlaxcala and Baja California Sur emitted each one of them, less than one percent of the national total.
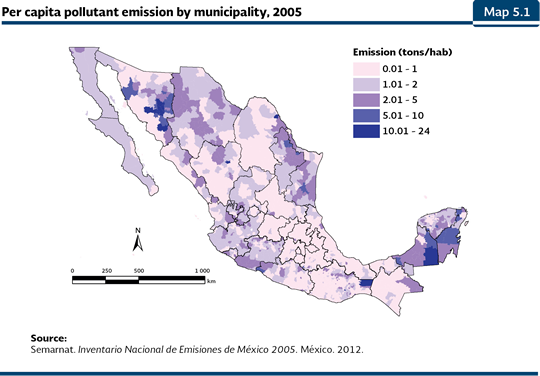
When the emissions of pollutants per capita6 are analyzed, it is observed, at a national level, in 2005, that each inhabitant emitted in average around 0.68 tonnes. If just the emissions from natural sources are considered, the figure is 0.15 tonnes per inhabitant while the emission, strictly anthropogenic were 0.53. The total emission per capita per municipality and borough shows that in 89% of the municipalities between 0.01 and 2 tonnes of pollutants in 2005 were generated. The five municipalities that reported a larger emission per capita were: Calakmul (23.9 tonnes; in Campeche), San Javier (20.05; Sonora), Santa María Chimalapa (18.5; Oaxaca), San Juan Lajarcia (15.6; Oaxaca) and La Colorada (15; Sonora), all of them with emissions generated mainly by natural sources (Map 5.1).
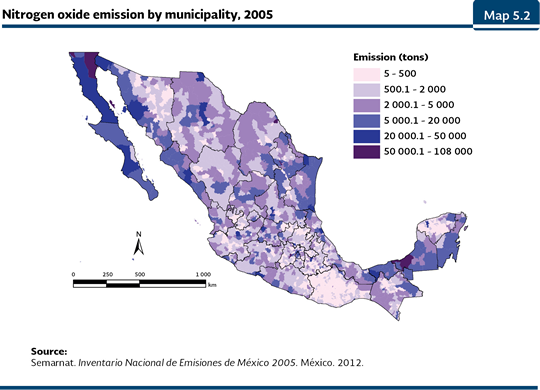
Concerning the total emissions per municipality and pollutant, in the case of the NOx it is observed that about 49% of the municipalities of the country emitted in 2005 between 5 and 500 tonnes, accumulating a little more than 236 thousand tonnes which represent 5.2% of the national total emitted of that pollutant (Map 5.2). If it is added, to these municipalities, the ones that emitted up to 5 thousand tonnes, it is reached 42% of the national total of the emissions and 93% of the municipalities of the country. In this way, the remaining 58% of the NOx emissions were generated by just 7% of the municipalities. Among the last ones, the municipalities Nava (Coahuila), Monterrey (Nuevo León), Tijuana and Mexicali (both of them in Baja California), Carmen (Campeche) and Toluca (State of Mexico) stand out with emissions between 50 and 108 thousand tonnes.
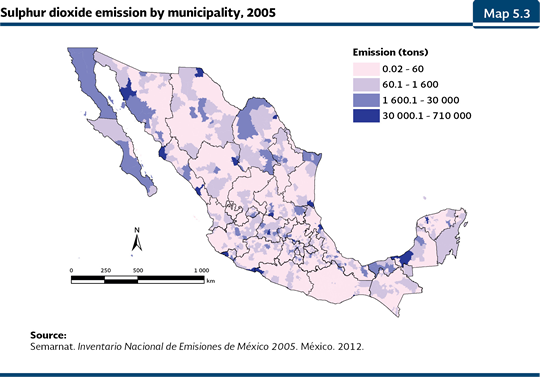
Concerning the SO2, 50% was concentrated in five municipalities: Carmen (Campeche), Tula de Allende (Hidalgo), Nava (Coahuila), Tuxpan (Veracruz) and Manzanillo (Colima), in all of them, the largest part of the emissions was generated by the fixed sources, particularly by the power generation plants and by the oil refineries (Map 5.3). Most of the municipalities of the country (78%) emitted between 0.02 and 60 tonnes of SO2, which just represent 1 percent of the total.
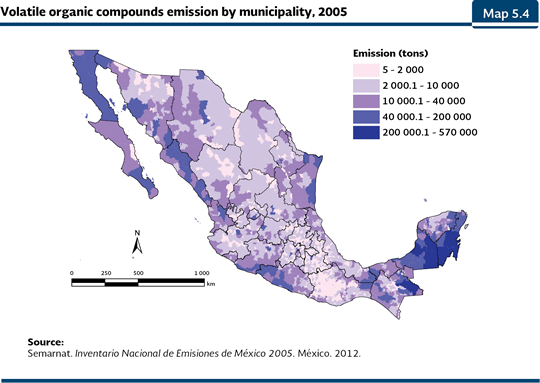
On the other hand, in the case of the COV, 44% of the municipalities generated amounts that went from five to two thousand tonnes, 40% emitted between two and ten thousand tonnes, 15.8% between ten and eighty thousand tonnes and 0.2% between eighty thousand and 570 thousand tonnes (Map 5.4). The six municipalities that emitted more COV were: Calakmul (Campeche), Felipe Carrillo Puerto and Othón P. Blanco (both of them in Quintana Roo), Ocosingo (Chiapas) and Hopelchén and Champotón (both of them in Campeche), which generated a little more than 2.48 million tonnes of COV (equivalent to 13% of the total emitted), mainly coming from natural sources7.
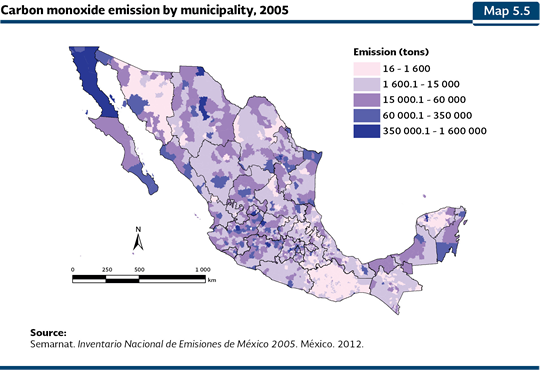
The CO was generated in a larger amount by the mobile sources in municipalities belonging to cities where the number of vehicles is high. The municipalities that emitted more CO were: Tijuana (Baja California), Guadalajara (Jalisco), Monterrey (Nuevo León), Toluca (State of Mexico), Mexicali (Baja California) and Morelia (Michoacán; Map 5.5).
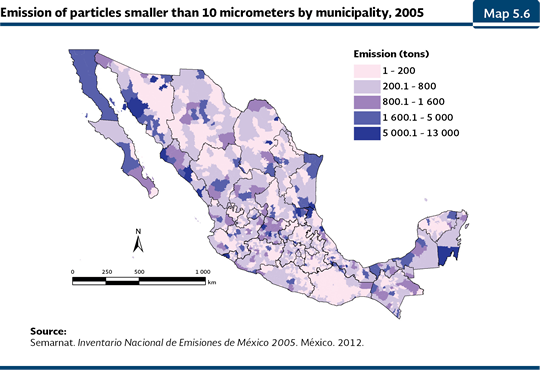
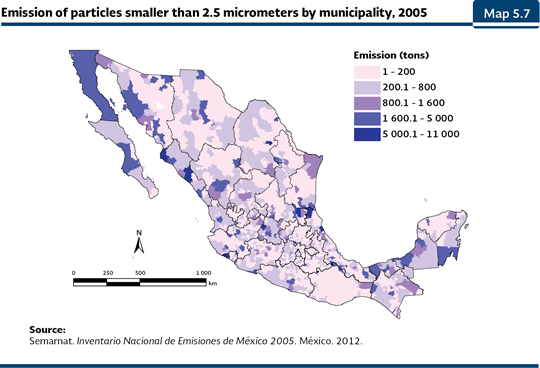
Concerning the PM10, 95% of the municipalities of the country emitted between one and 1,600 tonnes which represents as a whole 52% of the total emission of the pollutant (Map 5.6). The municipalities where the largest amount of PM10 was emitted are: Monclova (Coahuila), Tula de Allende (Hidalgo), Jaltipan (Veracruz), Manzanillo (Colima) and Culiacán (Sinaloa). Concerning the emission of PM2.5, 97% of the municipalities emitted between one and 1,600 tonnes, generating among all of them the 56% of the emitted total (Map 5.7%). The municipalities that emitted the largest volume of this pollutant are: Monclova (Coahuila), Tula de Allende (Hidalgo), Tuxpan (Veracruz), León (Guanajuato) and Manzanillo (Colima). Both types of particles were mainly generated by the fixed and area sources.
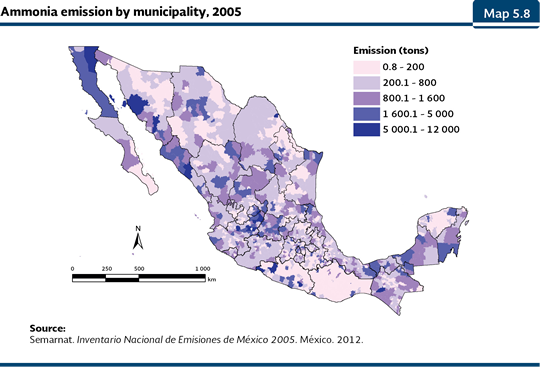
The ammonia (NH3) is mainly produced by the livestock activities, 95% of the municipalities produced between 0.8 and 1,600 tonnes, accumulating a little more than 592 thousand tonnes (which are equivalent to 59% of the total emitted NH3; Map 5.8). The five municipalities with the largest emissions were Nava (Coahuila); San Juan de los Lagos (Jalisco), Tepatitlán de Morelos (Jalisco), Culiacán (Sinaloa) and Huajuapan de León (Oaxaca), which emitted between 7,000 and 11,200 tonnes.
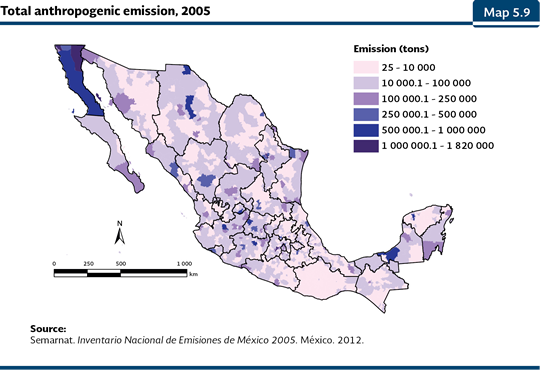
If the total emissions generated by the human activities are reviewed, at a municipal level, it is observed that 69% of the municipalities emitted between 25 and 10 thousand tonnes of pollutants, accumulating a total of about 4.4 million tonnes (8% of the total emitted; Map 5.9). The five municipalities that generated larger amounts of pollutants were Tijuana (Baja California), Guadalajara (Jalisco), Monterrey (Nuevo León), Toluca (State of Mexico) and Mexicali (Baja California) which, as a whole, emitted the national 12%.
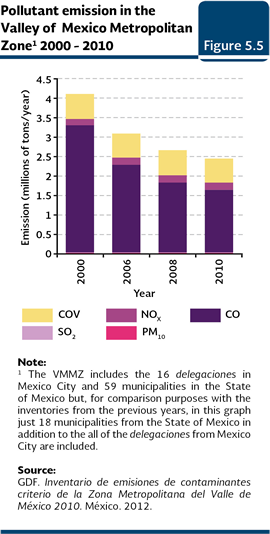
Emissions in the Valley of Mexico Metropolitan Zone In the VMMZ, the pollutant emissions for the period 2000-2010 have been estimated. The results emphasized in this section are the results obtained in 2010, while the changes that happened take as a reference the year 20008.
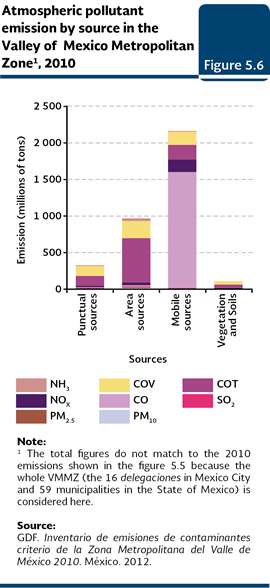
Concerning the origin of the pollutants, in 2010, 61% of the emissions came from the mobile sources, being the CO the pollutant that meant the largest proportion of the emissions by such source (74%; Figure 5.6). The high emissions related to the mobile sources, may be caused by factors such as the number of vehicles circulating, the amount of fuel they consume and the emissions from vehicles without incorporated control technologies (for instance, in 2010, 11% of the gasoline vehicles still did not have emission control systems). The private automobiles, since they are the largest number, generate the largest part of the emissions from the mobile sources; notwithstanding, the tractor, although they are less abundant, they contribute in a large proportion with the emissions of particles due to their diesel consumption (GDF, 2012).
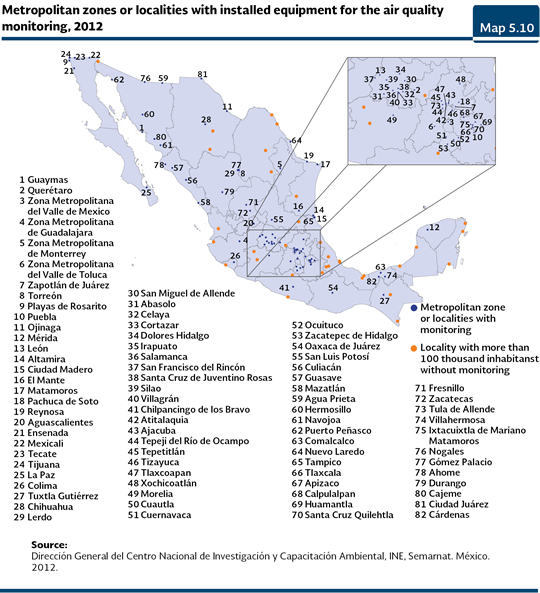
The area sources followed, in importance, the mobile sources (which emitted 27% of the total of the pollutants in the VMMZ), the punctual sources (9%) and the vegetation and soils (3% of the emissions). Regulations and monitoring of the air quality The atmospheric pollutants have negative effects on the health of the population, among them, the respiratory diseases and the cardiovascular problems (See Box Effects of the exposition to atmospheric pollutants on the health). Due to this reason, in different metropolitan areas and populations in the country the atmospheric concentration of the principal pollutants is monitored: SO2, CO, nitrogen dioxide (NO2), ozone (O3), PM10, PM2.5, total suspended particles (PST) and lead (Pb). For each one of them there is an standard or regulation of the air quality that establishes the maximum concentrations which should not go beyond the limit in a definite period, with the objective to guarantee the protection of the health of the population, including the most susceptible groups (Table D3_R_AIRE01_03). The air-quality standards currently in force were published by the Health Secretariat in the Federal Official Gazette in December 1994; in October 2002, the last modification to the regulations about ozone were published (DOF, 2002) and in September 2005, the modification to the one about particles, where the PM2.5 is included for the first time (DOF, 2005). On the other hand, the Semarnat is empowered to issue Mexican official standards which signal the procedures for the measurement and the calibration of the equipment that determines the pollutant concentrations, the authorized maximum levels of emission into the atmosphere as well as the specifications of the used fuels. In order to know the pollutants concentration, there have been an establishment of stations and atmospheric monitoring networks. Nowadays, there is installed equipment to measure the atmospheric pollutants in 82 metropolitan and populations (Map 5.10; IB 1.1-9; IC 6). Taking into consideration just the populations with over one hundred thousand inhabitants; there are 35 localities which do not have a monitoring of the air quality in the country. In all the stations and monitoring networks, the pollutants are measured using international standard procedures. The most complete and oldest network is located in the VMMZ, which has 26 stations of automatic monitoring (EMA), 2 stations of manual monitoring, 8 mixed ones and 2 mobile units. The monitoring stations record, among other variables, the concentrations of O3, CO, SO2, NO2, PM10 y PM2.5, considered as criteria pollutants and from which there is more information about their effects on the health. Since the lead concentration in the VMMZ has meaningfully decreased and it is considered it is under control, it is not included in this report.
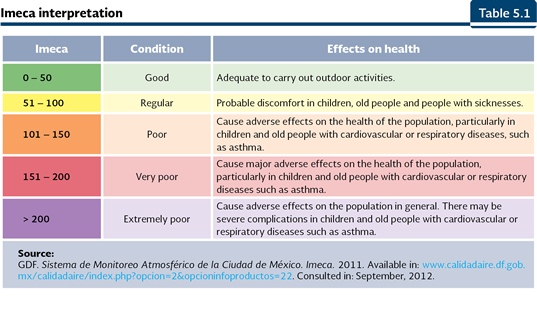
Other cities that have important monitoring networks, with records relatively old (from mid 1990s), are the metropolitan areas of Guadalajara, Monterrey, Toluca, and cities in the border such as Tijuana, Mexicali and Ciudad Juárez. Some cities are just focused on evaluating one or some pollutants with a local importance, as it is the case of Ajacuba and Tepetitlán in Hidalgo, Guaymas and Navojoa in Sonora, which are focused on the particle measurement. The complete list of the monitoring stations and the pollutants recorded may be consulted in the Database of Statistical Data of the National System of Environmental Information and Natural Resources. In order to make more understandable the level of the air pollution, in Mexico, it has been used an index known as Imeca (Metropolitan Index of the Air Quality), which consists in a transformation of the concentrations of the pollutant into a dimensionless number. In the scale used by the Imeca, the values are determined in multiples of 50 Imecas. The Imeca spread started in 1986 through several means and currently it is casted by radio, television, Internet and written press. However, since there was not and official document to define the meaning and the use of the Imeca, as well as the regulations for its creation, use and spread, there was not a uniformity of its procedures among the different generators in the states. This took Mexico City to create the environmental standard NADF-009-AIRE-2006 (GDF, 2006), which establishes the regulations that the Imeca must meet. This standard is applied in Mexico City and it is expanded towards the surrounding municipalities belonging to the state of Mexico which are part of the VMMZ. According to this standard, the objective of the Imeca is to inform the population in a clear, timely and continuous way about the atmospheric pollution level, the probable damages to the health and the protective measures that may be taken. With this new regulation, the Imeca spread is made by means of colors and qualifiers about the air quality, depending on the risk degree that represents for the human health (Table 5.1). However, in order to analyze the fulfilling of the air quality standards in a specific region, it is more advisable to use indicators generated from the databases validated by the atmospheric monitoring networks and with application of the same criteria during the processing of the information (INE, 2007).
Based on the Imeca values, the authorities may declare an environmental contingency, which refers to an eventual and transitory situation, where the pollutant concentration in the atmosphere reaches harmful levels for the health of the population in general. Some of the cities and industrial areas that have environment contingency programs for atmospheric pollution are the Valley of Mexico, Guadalajara, Monterrey and Salamanca. In the VMMZ, the last time an environmental contingency for ozone was declared was in 2002 and for PM10, in 2005. In the VMMZ, some of the measures applied, fully or partially, during a contingency are the suspension of: sport, civic, and outdoor entertainment activities, open air burns, street patching and painting activities, restriction to the vehicle circulation, in addition to the Not Driving Program and the restriction to the industrial activity, among others.
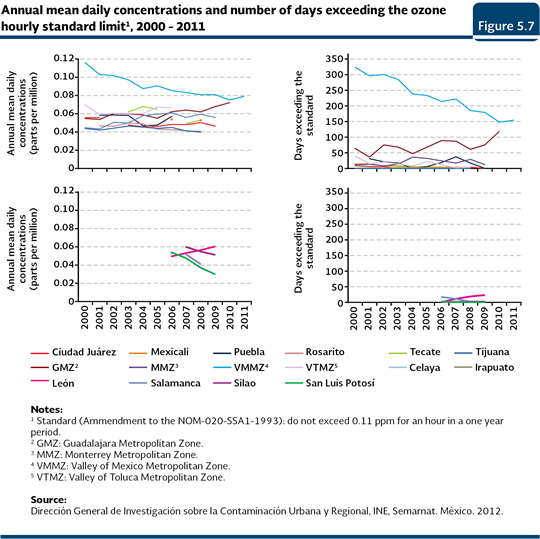
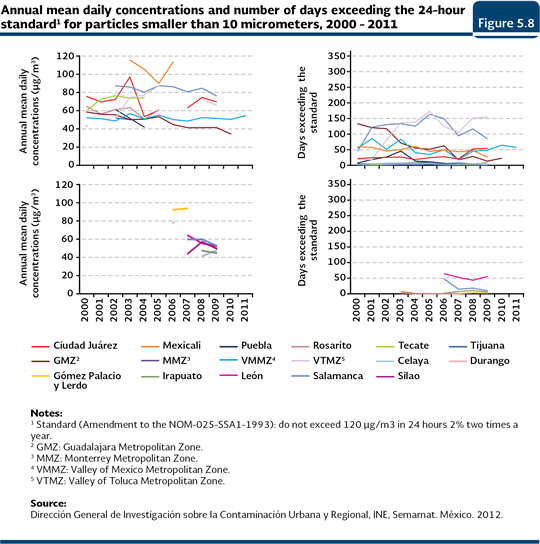
Air quality in Mexican citiesy There are several ways to approach the air quality. In this report it was used the number of days in a year when the value of the standard related to each pollutant is exceeded, as well as the annual averages of the daily concentrations of PM10, PM2.5, SO2, O3, NO2 and CO. The days when the value of the standard is exceeded show the extent of the problem, because they show the frequency the defined threshold is exceeded to protect the health; besides, along with the tendencies of the annual averages of the concentrations allow having a vision of the temporary dynamics of the air quality and they are a means to evaluate the effectiveness of the measures taken to control the problem. In order to have a more integral picture of the air quality, it has also been included the number of days per year, where the standard is exceeded by any of the criteria pollutants, because if at least one of the pollutants exceeds the permitted levels, the air quality is not appropriate. In this chapter, the air quality of those cities of the countries that have reliable information to carry out a proper analysis is described. If the frequency the limits established in the standards are exceeded is analyzed, the two most important pollutants in the monitored cities is O3 (Figure 5.7; Box D3_AIRE01_06; IB 1.1-7) and the PM10 (Figure 5.8; IB 1.1-5). The O3 is the principal problem in the VMMZ, since the number of days the time standards is exceeded is still high (154 days in 2011, which represents 42% of the year); notwithstanding, it is largely low if it is compared to the records of the beginning of the last decade (for instance, 323 days in 2000). The Guadalajara Metropolitan Zone (GMZ) has reported, for the period 2001-2010, values between 36 and 118 days where the standard is exceeded. The other cities have reported values below 40 days in the periods for which there is information. The VMMZ, Monterrey Metropolitan Zone (MMZ), GMZ and Rosarito show a tendency towards a reduction of the annual averages of the daily concentrations of O3, while Ciudad Juárez, Puebla, Tecate, Tijuana and the Valley of Toluca Metropolitan Zone (VTMZ) did not show meaningful changes (Figure 5.7; IB 1.1-7). Concerning the PM10, although in some cities it is not possible to observe a clear tendency or there are not meaningful changes, the GMZ is the only one that reports an improvement in the period 2000-2010. In contrast, the VTMZ dramatically increased the number of day when the standard is exceeded in the period 2000-2009. The VTMZ and MMZM are the areas that report the highest number of days (154 and 85, respectively in 2009) when the daily standard is exceeded. In contrast, there are cities such as Tijuana, Tecate, Rosarito, Celaya, Irapuato and Silao where the frequency the permitted standard is exceeded is very low (between 1 and 8 days in 2009) or is zero as it is the case in Puebla in 2008-2009 (Figure 5.8; Table D3_AIRE01_06; IB 1.1-5).
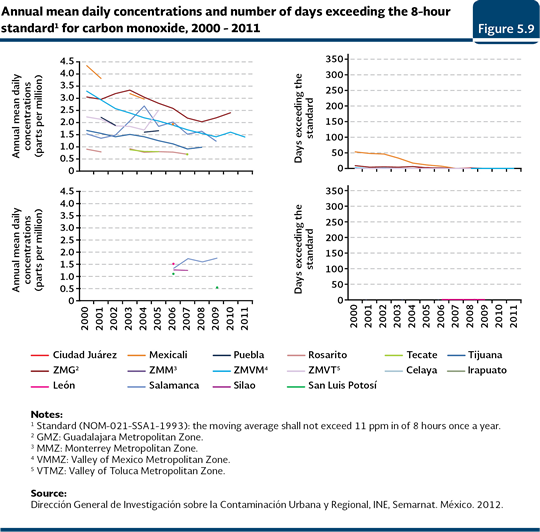
In the last years the atmospheric concentration of CO has not been a serious problem in practically, any of the cities with monitoring. The number of days when the permitted limit of CO is exceeded has decreased in some cities such as Mexicali and GMZ and it has remained steady, between 3 and zero days, in Ciudad Juárez, Puebla, Rosarito, Tecate, Tijuana, MMZ, VMMZ and VTMZ (Figure 5.9; Table D3_AIRE01_06; IB 1.1-3).
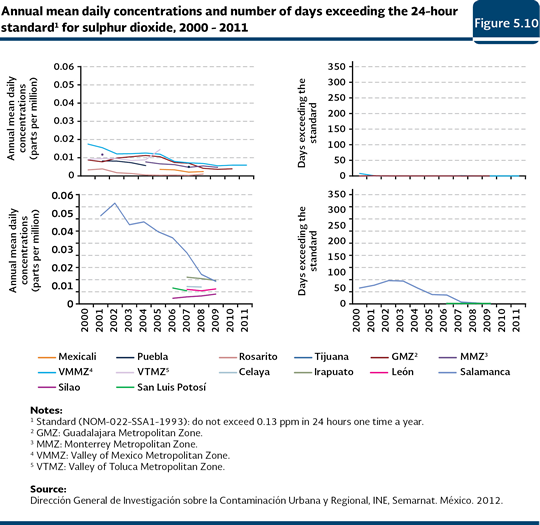
The SO2 is also under control in almost all of the cities where it is measured; in the reported period, practically, the standard was not exceeded any single day, with the exception of Salamanca, which in 2000 reported 51 days with levels higher than the permitted ones; notwithstanding, in 2009 the standard was not exceeded any single day in that city (Figure 5.10; Table D3_AIRE01_06; IB 1.1-6). As a sample of the former, the daily concentrations were relatively low in all the cities with monitoring in the period, with the exception already noted of Salamanca, that although it reported higher concentrations, they have dramatically decreased in the last years.
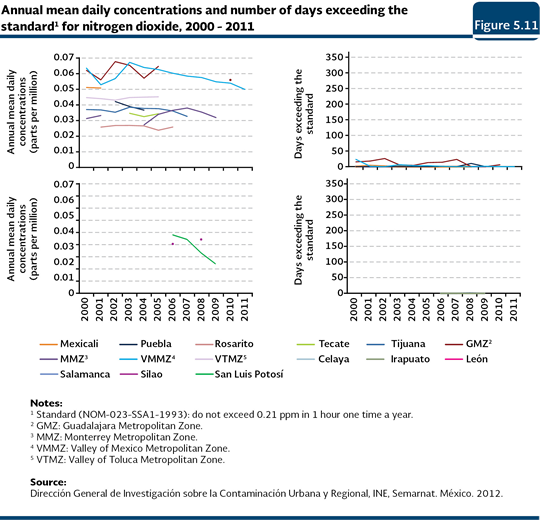
The problem of pollution for NO2 is also under control, practically, no city with monitoring exceeds the standard (just in the GMZ the standard was exceeded six days in 2010). The concentration has been relatively steady and below 0.05 parts per million in most of the cities (Figure 5.11; Table D3_AIRE01_06; IB 1.1-4).
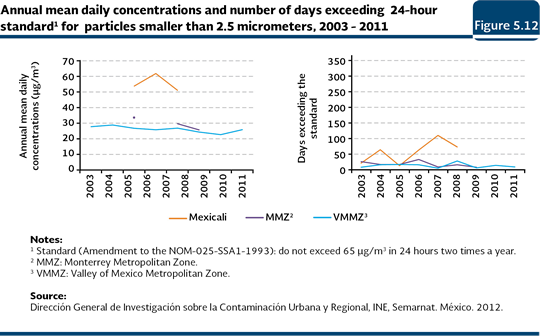
The monitoring of the particles below 2.5 micrometers is the most recent one. Between 2004 and 2011, the VMMZ slightly reduced its concentration. In the rest of the cities with monitoring it still cannot be appreciated their tendency due to the lack of data. The number of days per year when the standard was exceeded, practically, remained in the same levels in the MMZ and the VMMZ, different from Mexicali whose values were between 13 days in 2005 and 110 in 2007 (Figure 5.12; Table D3_AIRE01_06; IB 1.1-8).
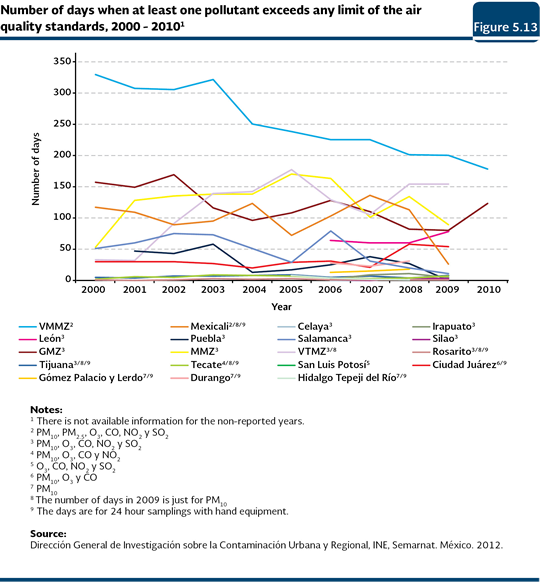
Although it is possible to analyze in detail the situation of every pollutant in the different metropolitan areas and in some cities using the previous graphs, it is not possible to evaluate, in an integral way, the air quality. Therefore, and with the objective to summarize the air quality in each city with a monitoring system, Figure 5.13 shows the number of days when at least one of the monitored pollutants exceeded its limit established in the standard. This information becomes relevant in the analysis since the air quality is deteriorated when at least one of the monitored components surpasses the concentration limits established in the standards. According to this information, the big cities are the ones which have the largest problems, even though they have tendencies toward a decrease over recent years. For instance, the air pollution in the VMMZ at the beginning of the last decade, exceeded the permitted levels between 329 and 305 days a year, and later it showed a clear downwards tendency reaching 178 days in 2010. Guadalajara and Mexicali also report a meaningful number of days in 2000 (157 and 117 respectively) and later there is a decrease (123 days in 2010 and 26 in 2009, respectively). Concerning Salamanca, even though it has reported up to 79 days (2006) with values higher than the permitted ones, in 2009 this figure decreased to 11 days. In contrast, Monterrey and the Valley of Toluca have increased the number of days when the limits established in the standards are exceeded. In the rest of the cities with monitoring the limits have not been exceeded in more than 58 days per year, in fact, in some of them the maximum has been 11 days, this is the case of Tijuana, San Luis Potosí, Irapuato, Celaya, Silao, Tecate, Rosarito, and the Metropolitan area of Hidalgo and Tepeji del Río de Ocampo. It is important to note that the tendency of the number days where the health standards are exceeded, each city shows its particular condition, so, the comparison among them must be done with reserves because not all of the cities or urban areas monitor all of the pollutants (Figure 5.13).
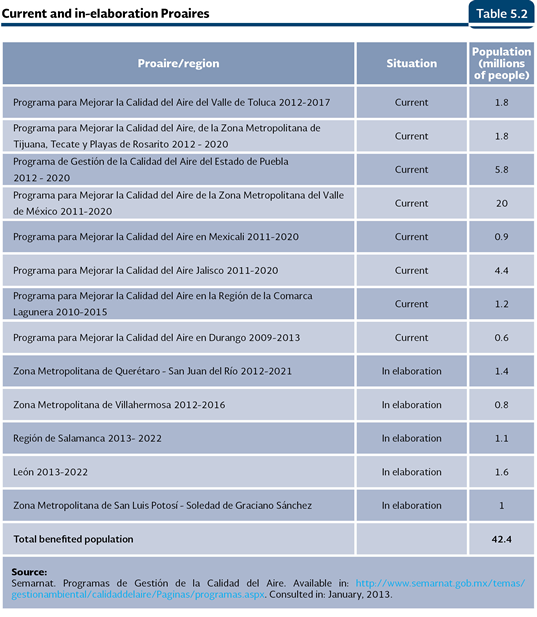
Although currently there are monitoring stations of the principal pollutants in 82 cities, they are still not enough to have a national coverage. Besides, in most of the cities, the information still does not have the necessary characteristics to make a reliable analysis of the tendency of the concentrations of the pollutants: just twenty of them have enough information to know the air quality for at least three years in a row, nine localities for five years an only the metropolitan areas of Monterrey, Guadalajara and the Valley of Mexico have generated, in a steady way, the information since they started operations (INE, Semarnat 2011). In the case of the VMMZ, its monitoring network also records the information related to the acid rain. In 1987 the Program of Acid Precipitations in the Metropolitan Area of Mexico City was implemented (see Box Acid Rain: causes and consequences). In summary, from the analysis of the tendencies of the principal pollutants, it is noticed that in general the air quality in the principal cities of the country has improved in the last years. Although, in the VMMZ the air quality is deficient, mainly because of the levels of O3, it is important to highlight that there is a downwards tendency in its concentration, as well as with the other pollutants, for instance, the CO, SO2 and PM2.5. Undoubtedly, the elimination of lead in the gasoline, the reduction of the sulphur content (both in the gasoline and diesel), the introduction into the market of oxygenated and reformulated gasoline, the establishment of tighter emission limits for new vehicles, as well as the adoption of vehicle technologies more efficient every time, have contributed in a meaningful way, that the lead is not a pollution problem for the air anymore and that the levels of SO2, CO y NO2 rarely exceed the normal standards As a response to the problem of air pollution, the federal government, coordinated with state and municipality authorities, and with the participation of the academic sector, has established programs to improve the air quality, known as Proaires. These programs represent one of the principal developed instruments to reverse the deterioration tendencies and they include a middle and long term vision, besides proposing concrete actions for the reduction and control of the emissions (Semarnat, 2010). The actions included in these programs are oriented to the sources with the largest contribution of pollutants and they include reduction measures which are feasible in their cost and with a meaningful benefit in the air quality. The Proaires have been applied in metropolitan areas that, due to their features, such as the number of inhabitants, industrial activities, vehicle fleet and climatic and geographic conditions, among others, show the largest problems of atmospheric pollution. The metropolitan areas for which, at least a Proaire program has been developed are the Valley of Mexico, Monterrey, Guadalajara, Toluca, Ciudad Juárez, Mexicali, Tijuana-Rosarito, Salamanca, Puebla, León, Cuernavaca, Durango and the Comarca Lagunera (which includes parts of Coahuila and Durango), Querétaro-San Juan del Río, Villahermosa and San Luis Potosí-Soledad de Graciano Sánchez (IB 1.1-10). Nowadays, there are eight valid Proaires and other five are in the phase of elaboration or being updated (Table 5.2) The valid Proaires benefit 36.5 million people who live in the areas of application of the measures to improve the air quality; on the other hand, the Proaires under elaboration will benefit a population of about 5.9 million people (Semarnat, 2013).
As a part of the measures to control the problem of the air pollution, in January 2006 the standard NOM-086-SEMARNAT-SENER-SCFI-2005 was published, which establishes new specifications for the fuels that are sold in Mexico; they are mainly related to the content of sulphur, olefins and benzene. The trading of these fuels has been gradual: for instance, in January 2005, the Magna gasoline was released into the market, with 300 parts per million (ppm) sulphur average and 500 ppm maximum; in October 2006, the Premium UBA (ultra low sulphur) gasoline was released into the market, with 30 ppm sulphur average and 80 ppm maximum for the consumption all over the country. Besides, at the beginning of 2007, it was started the trading, in the northern border, of diesel UBA of 15 ppm maximum, which since 2009 is also distributed in the Metropolitan area of Monterrey, while since the final part of the same year, it is used in the Metrobús of Mexico City. Other actions implemented at the local level, such as the reforestation and pavement, the support for the renovation of the vehicle fleet and the tighter control over the emissions from the fixed sources have also been important. Notwithstanding, a larger investment is required to control and reduce the air pollution. The expense of the public sector designated to prevent and control the atmospheric pollution, increased from 69,598 million pesos in 2009 (barely 0.1% of the total environment expense) to 123,830 million pesos, which meant 2.2% of the total environment expense, which also includes activities on waste water, waste, soils, ground water, biodiversity, scenery, ecological programs for regulation and preservation, ecological structure, human regulation of the establishments and environmental education issues, among other activities (INEGI, 2011 and 2012).
Notes: 1 Natural sources: they include biogenic sources such as the vegetation and the microbial activity of the soil. In 2005, emissions by volcanic activity were not reported -another important source of emissions, intermittent though-, since a meaningful activity was reported.
|