| La información más reciente sobre vegetación y cambio de uso del suelo en México, se encuentra en los Indicadores Básicos y Clave. |
| CHAPTER 2. TERRESTRIAL ECOSYSTEMS |
USE OF NATURAL RESOURCES FROM TERRESTRIAL ECOSYSTEMS The enormous area that covers the natural vegetation in the country, offers, besides a wide range of environmental services, a great potential for the exploitation of its natural resources. Nowadays, although most of the food that the mankind consumes comes from plants and domesticated animals, this does not mean that its dependency of the wildlife is minimal or non-existent. A large part of the population, especially the one which is found in a poverty situation and inhabits rural areas, uses timber as a source of energy, and millions of people obtain almost all their diet protein from fishing or hunting. Although many of the products which were extracted from wildlife populations, now they are cultivated (i. e. fish farms), it is still very common that in the developing countries the man does not take part in the production or rising of the organisms that he consumes, but they just obtain them from the wild. While the variety of the products which are extracted from the national terrestrial ecosystems is varied, this section will focus on the exploitation of the natural resources of the forestry areas and preferably forestry, in other words, of the timber and non-timber resources from temperate forests and tropical forests. This responds, basically, to the existence, quality and availability of the information. In the case of the use of the wildlife, it is analyzed in another section of this chapter and in the one dedicated to Biodiversity. Tropical and temperate forests, as it has been mentioned, offer several environmental services to society. However, the most tangible contribution to society is the variety of the goods exploited in them: on one side, the timber products, which basically involve the timber for the square production (boards, thick plank, beams and packaging materials) paper, sheet, plywood and for the power generation by means of burning timber; and for other non-timber products, a large variety that includes forest soil, resins, fibers, waxes, fruits and living plants, among many other uses (SCBD, 2010b).
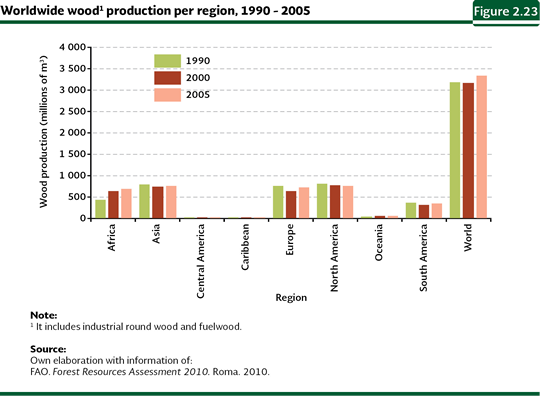
Between 1990 and 2005, the world production of timber was kept relatively steady, with volumes slightly larger than 3 thousand million cubic meters of timber per year, which include both the round wood for industrial use and the wood use as firewood (Figure 2.23). The most productive wood regions in 2005 were North America (with 23% of the world production), Europe and Asia (each one with 22%) and Africa (21%); in contrast, the regions with the lowest volumes were Central America (0.6% of the total) and the Caribbean (0.2%). In spite of the stability in the values of the world production in that period, between 2000 and 2005 some regions showed negative growth rates in their timber production, just as in the cases of the countries of the Caribbean (-0.15%) and North America (-0.39%).
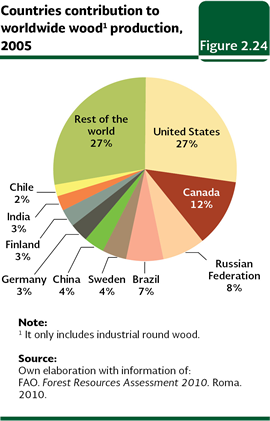
At the country level, the largest round wood producers in 2005 were the United States (27% of the global production), Canada (12%), The Russian Federation (8%), Brazil (7%), Sweden and China (each one with 4%; Figure 2.24). The mentioned countries, as a whole, accounted to 62% of the world production of timber in that year, while Mexico contributed with just 0.3% of the world production.
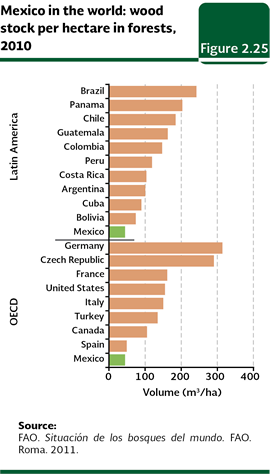
The timber existences of a country mainly depend on the extension of their forests and tropical forests. However, it is also determining the amount of wood they have per unit of area, which depends in the ultimate instance both the climate (i. e. the temperate forests in general, have more resources per unit of area) and the way they have managed the vegetation. The countries with the largest existences of timber are the Russian Federation, Brazil, Canada and the United States. In the particular case of the forests of Mexico, they are considered to be found among the ones which have fewer existences per hectare both from the countries that are members of the Organisation for Economic Co-operation and Development (OECD) and Latin America (Figure 2.25).
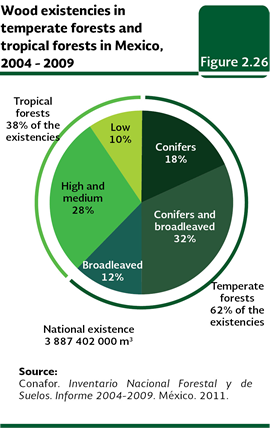
National timber existences As of today, there have been four national forest inventories, although because of the methods used their results are not comparable among themselves. The first inventory was done in the period 1961-1985, using aerial photographs and making and intensive field sampling. The second one, the Forestry National Inventory of Large Scope from 1991, was the first one to include information at a national level. The third inventory, known as the Periodical Forestry National Inventory, published in 1994, used satellite images of a moderated resolution to elaborate maps of all the national territory at a scale of 1:250,000; the collection of the field information was made by means of sample plots systematically distributed and maps where the forestry lands were zoned according to their aptitude and functions were obtained. Finally, National Inventory of Forest and Soil 2004-2009 (INFyS; Conafor, 2011) is the most recent version. For this inventory, direct field samplings were made between October 2004 and November 2007, in over 20 thousand conglomerates (in other words, in plots with four sites of sampling each), what it would be equivalent to over 80 thousand sites distributed in all of the vegetation types in the country, 98% of which was sampled for the collection of the forestry data relevant about the wooded areas and the shrub stratum, as well as the different aspects of the soil and the environment. One of the most remarkable aspects of this inventory is the wealth of the information it includes. Its sampling design made possible to gather reliable statistical information of a great variety of variables (a total of 112 field variables were measured), some of them stand out: density and height of the trees, data for the calculation of the volume of round wood and the annual average increase of the volume, among others, all of them at the ecosystem level and by the type of formation. According to the preliminary data gathered by the inventory, between 2004 and 2007, in the country there were about 3,887.4 million cubic meters of standing round wood in tropical and temperate forests in the country, all in a forestry area of around 63.4 million hectares. From the total of timber, the highest percentage is in the temperate forests6 (62% of the total, in other words, around 2,424 million cubic meters) and the remaining in tropical forests (38%, which is equivalent to nearly 1,463 million of cubic meters; Figure 2.26).
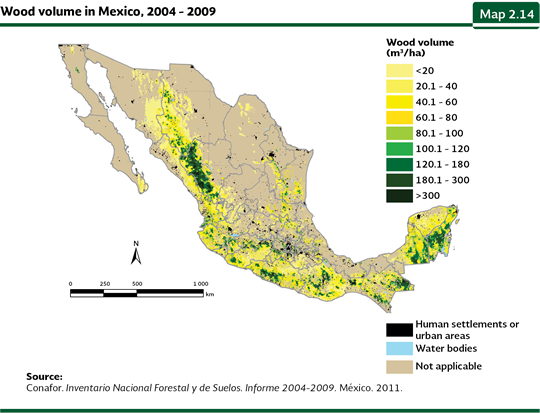
The most important deposits of round wood in the country are in the mixed forests of coniferous and broadleaved, with nearly 32% of the total national volume, in other words, nearly 1,240 million cubic meters (Figure 2.26). They are followed by the high and medium tropical forests (28%, a little more than a billion cubic meters), and the coniferous (18%, around 707 million cubic meters) and broadleaf forests (12%, 477 million cubic meters). Geographically, the wooden areas with the highest volumes of timber are located in the mountain range of Durango, with values over the 100 cubic meters per hectare (Map 2.14), although they may be found with large volumes in the forests of Oaxaca, Chiapas and Guerrero. On the other hand, tropical forests with the highest timber volumes are located in the southeast in the states of Chiapas, Quintana Roo and Campeche. As it may be observed in Map 2.14, the largest part of the national forestry area corresponds to areas with limited volumes of stocked timber, in other words, temperate and tropical forests with productivity of around 60 cubic meters or less per hectare.
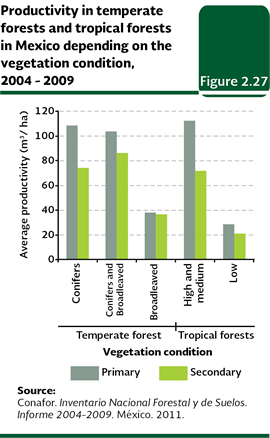
The condition of the vegetation also shows important differences in the volumes of timber that temperate and tropical forests keep: most of the proportion of the timber existences of the country is located in the primary vegetation: about 60% of the national total volume, in other words, nearly 2,417 million cubic meters. The formation with the highest average production are the primary high and medium tropical forests (around 112 m3/ha, value 36% higher than its secondary condition), followed by coniferous forest (108 versus 74 m3/ha in its secondary condition) and the conifers and broadleaf forests (104 versus 86 m3/ha; Figure 2.27).
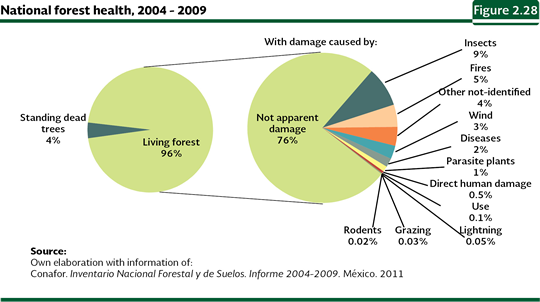
Annually, due to the growth of the trees and their sprouts, the volume of timber that exists in the timber masses increases. Such growth becomes fundamental to calculate the volumes that may be used in a sustainable way in an area in a specific period. According to the data from the INFyS, the timber volume that is accumulated in the forests of conifers of the country amounts to 2.29 cubic meters per hectare per year, which surpasses the 1.88 cubic meters per hectare estimated for the mixed forests of coniferous and broadleaf forests. Taking into consideration the productivity of all types of forests in the country it may be estimated that every year the national forests would increase their inventory in 15.5 million cubic meters. In the case of tropical forests, it is impossible to estimate the increase of the national existences because the INFyS 2004-2009 just measured the annual average increase in volume on conifers and not in the proper species of tropical forests. On the other hand, the health of the forestry masses is relevant not just because it allows a proper exploitation of their resources, but also because it keeps the other environmental services temperate and tropical forests offer to the society. The INFyS also evaluated the health of the national forests and tropical forests through the environment impacts and the disruptive agents which deteriorate them. According to their results, from the total amount of sampled trees, 96% was for living trees and the remaining 4% is found standing death (Figure 2.28). Although it was impossible to know the mortality reasons out of the total of the trees, the insects, the fires, the wind and the diseases were acknowledged as the principal agents. However, not all the sampled living trees were found healthy. Although 76% of the examined trees did not show an apparent damage, the remaining 24% showed signs of any causal agent; insects (9%), fires (5%), wind (3%), diseases (2%) and parasitic plants (1%) among other agents (Figure 2.28).
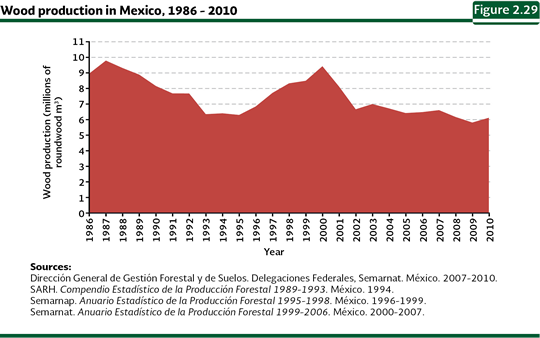
Timber forestry production The annual timber production between 1986 and 2010 averaged a figure close to 7.5 million cubic meters in rolls; however, although the production has shown a variable behavior, a tendency towards reduction may be observed (Figure 2.29; Table D3_RFORESTA04_01). A proof of the former is that the average of the production during the first decade of the 21st century was nearly 13% below the average recorded between 1986 and 1999.
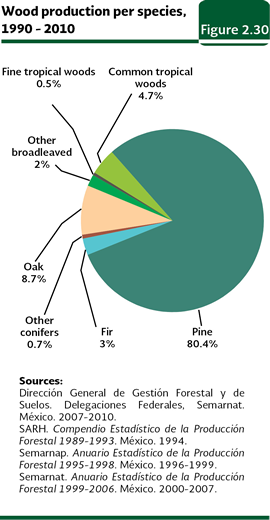
The national production is based above all on the wood from the temperate forests: the coniferous (which involve pines and oyamels, among others), and the broadleaf (oaks and other species) accounted, in the 1990-2000 period, to nearly 95% of the national production, followed by the common tropical woods (4.7%) and the precious woods which contributed little to the produced wood volume (just 0.5%) in the same period (Figure 2.30; Table D3_RFORESTA04_O2). The principal used species between those years were the pine (120.3 million cubic meters in roll, this is, 80.4% of the production of the period) and the oak (13 million cubic meters, 8.7%: Figure 2.30).
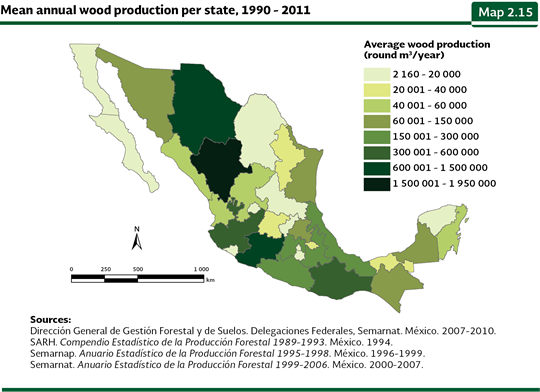
The states which contributed the most to the wood forestry production in the period 1990-2011 were Durango (1.95 million cubic meters per year in average, 27% of the total production in the period), Chihuahua (1.41 million, 20%) and Michoacán (971 thousand, 14%; Map 2.15; Table D3_RFORESTA04_01). In contrast, Baja California, Morelos and Colima were the ones which contributed in a lower proportion to the total national volume (0.03, 0.04 and 0.06%, respectively).
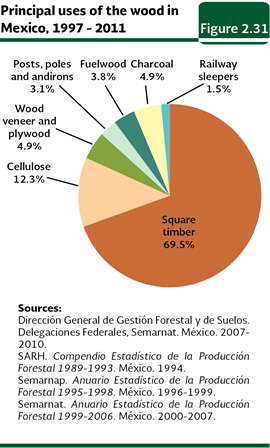
Different from what happens in other countries, where the growing demand for cellulose to manufacture paper is the most important engine behind the wood exploitation, in Mexico the principal use of wood has been for squaring, in other words, for the production of boards, thick plank, beams and packaging material. 69.5% of the total volume of extracted wood between 1997 and 2011 was used for this purpose (Figure 2.31; Table D3_RFORESTA04_03); followed by the extraction to manufacture cellulose (12.3% of the volume total in the same period); and for wood veneer and plywood and coal (each one with 4.9%).
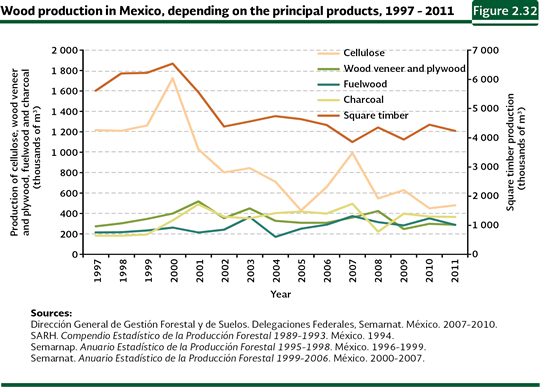
The fall of the wood national extraction is shown in the decrease of the squaring and cellulose production during the 1997-2011 period (Figure 2.32). In the case of the squaring, the production volume of the last nine years has not gone beyond 70% of the maximum production in the period (nearly 6.5 million cubic meters in roll in 2000). The case of the cellulose is also meaningful: the value in 2011 was just 28% of the production in 2000 (about 1.72 million cubic meters in roll).
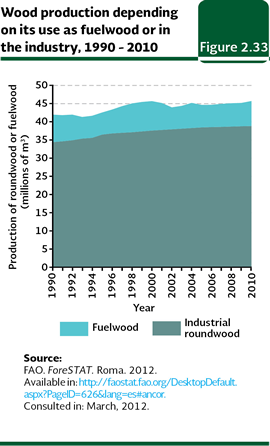
According to such data, the wood used as energy is minimal en Mexico, because between 1997-2011 it was used, in average, just 3.8% of the production, as firewood and 4.9% as coal (see Figure 2.31) These figures contrast strongly with the estimate made by the FAO of around 38 million cubic meters per year in average between 1997 and 2010 which would be 85% of the wood national production of that period (Figure 2.33).
It is important to note that the data about the timber production does not include the “firewood harvest” in a large part of the rural areas, the arid areas or in the roadsides, which is mainly used as firewood by the rural population. It is very likely that the factor that influences more strongly over the discrepancy between the national data and the FAO data could be that the firewood cutting is done without reporting it to the federal authorities. This activity takes place in rural areas and it is managed, in the best of the cases, by local decision-making entities. In order to achieve a sustainable use of the wood, the wood volume which is extracted must be less than the natural renovation of the forests. If the exploitation is over the renovation, natural resources and their future availability are being degraded. The INFyS 2004-2009 calculated estimates over the renovation rate (called “annual increase”) for the coniferous, the most used group in an industrial way with timber uses. According to this data, the annual increase of coniferous in Mexico is about 15.5 million cubic meters of roundwood, which is above (a little more than three times) the production recorded for this group of species in 2011. This would suggest the production capacity of the coniferous forests in the country has not been surpassed, we must remember that the heterogeneity in the availability, the use and the land use change in the country could show, at a local level, different scenarios.
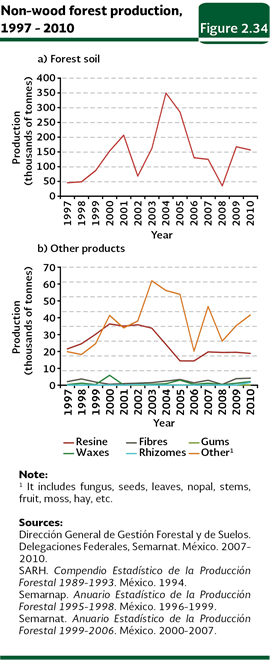
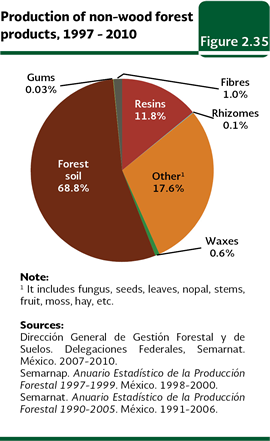
Non-timber forest resources The non-timber forest resources (NTFPs) received, in general, less attention in comparison to the attention the timber resources receive. However, they provide an important variety of products such as medicinal, food, materials for construction, resins, rubber, dyes, waxes, forest soil, essences and oils, among others. In general, they lack a wide and consolidated market (different from the timber products) and they are exploited mostly locally by people with scarce economic resources. Due to the former, it is likely that an important part of the use of these resources is not accurately assessed in many regions-especially the rural ones-, where the users are not forced to report their extraction. That is why the values reported in this work surely are sub estimates of their real use in our country and maybe that is why the wrong notion that the NTFPs is a resource of scarce economic value still persists. The national production of NTFPs showed strong oscillations in the 1997-2010 period, with an average of a little more than 209 thousand tonnes per year. The production is mainly influenced by the extraction of forest soil which oscillated between a little below 35 thousand and 350 thousand tonnes per year and it accumulated 68.8% of the total volume of NTFPs between those years (around 2 million tonnes; Figure 2.34a). Due to the importance of volume production in the period, they are followed by the resins (11.8% of the total volume of PFNM, nearly 347 thousand tonnes) and the fibers (1%, a little more than 29 thousand tonnes; Figures 2.34b and 2.35; Table D3_RFORESTA04_05).
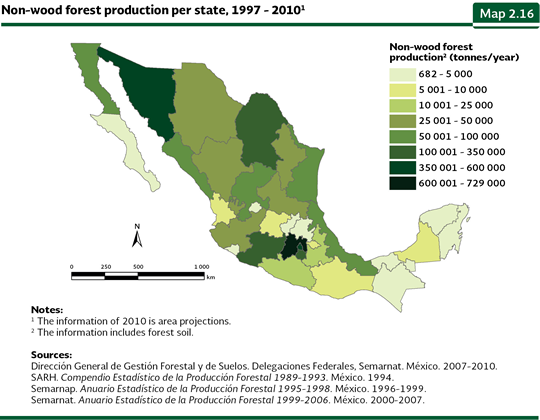
While the fibers and the waxes are not the most important products about the production volume (as a whole they added up to just 1.6% of the NTFPs volume of the period, Figure 2.35), they are the support for many families with a low income in the country. They are generally produced in the arid and semi arid areas from the plants of the families Agavaceae, Bromeliaceae and Euphorbiaceae. The states which recorded the highest non-timber production between 1997 and 2010 were the State of Mexico (728,273 tonnes; 21.9% of the total of the period), Distrito Federal (591,288 tonnes; 17.8%) and Sonora (587,987 tonnes; 17.7%); in contrast, some of the states which produced low quantities were: Quintana Roo (682 tonnes; 0.02% out of the total), Aguascalientes (753 tonnes; 0.023%) and Baja California Sur (968 tonnes; 0.03%; Map 2.16; Table D3_RFORESTA04_04).
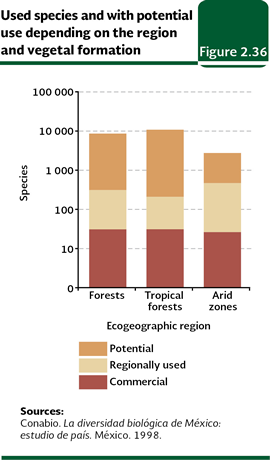
One feature of the exploitation of the NTFPs is the scarce variety of products and wild species where it is focused. If we take into consideration that the flora wealth of the country reaches a little more than 25 thousand species just for the case of the superior plants, the amount of them that it is used is very low, because they do not reach 100 species which are commercially exploited and less than one thousand species that have a regional use (Figure 2.36; Table D3_RFORESTA04_06).
A collateral effect of this concentration in just a few products is that the economy of the people and communities that depend on them becomes vulnerable to the market fluctuations, which could leave the producers in a very compromising situation if the prices of these products decrease dramatically; this situation has happened in the past, for instance, to the candelilla wax, chicle and barbasco producers. In addition to its economic potential, it has been suggested that stimulating the use of some of the PFNM may be an excellent alternative to preserve the natural vegetation where it is found, since natural ecosystems with a certain conservation level are required for their permanence. Note: 6 The inventory classifies within the category of forests to the coniferous, coniferous and broadleaf, and broadleaf. Their grouping considers all types of vegetation that this publication classifies as “temperate forests”, in addition to the gallery forest (see Table 2.1). In the case of tropical rainforests (which the inventory classifies as high, medium and low) does not include the subtropical shrubland that this work actually classifies within the category of “subhumid tropical forest”.
|