| La información más reciente sobre vegetación y cambio de uso del suelo en México, se encuentra en los Indicadores Básicos y Clave. |
| CHAPTER 2. TERRESTRIAL ECOSYSTEMS |
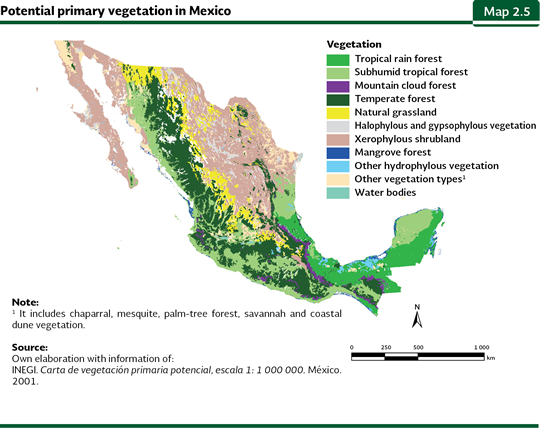
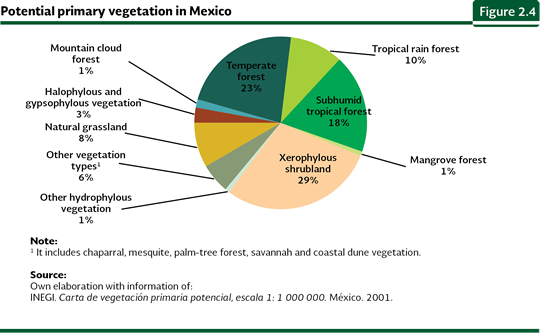
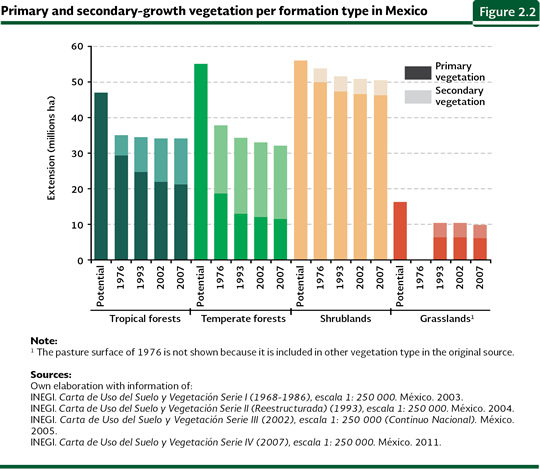
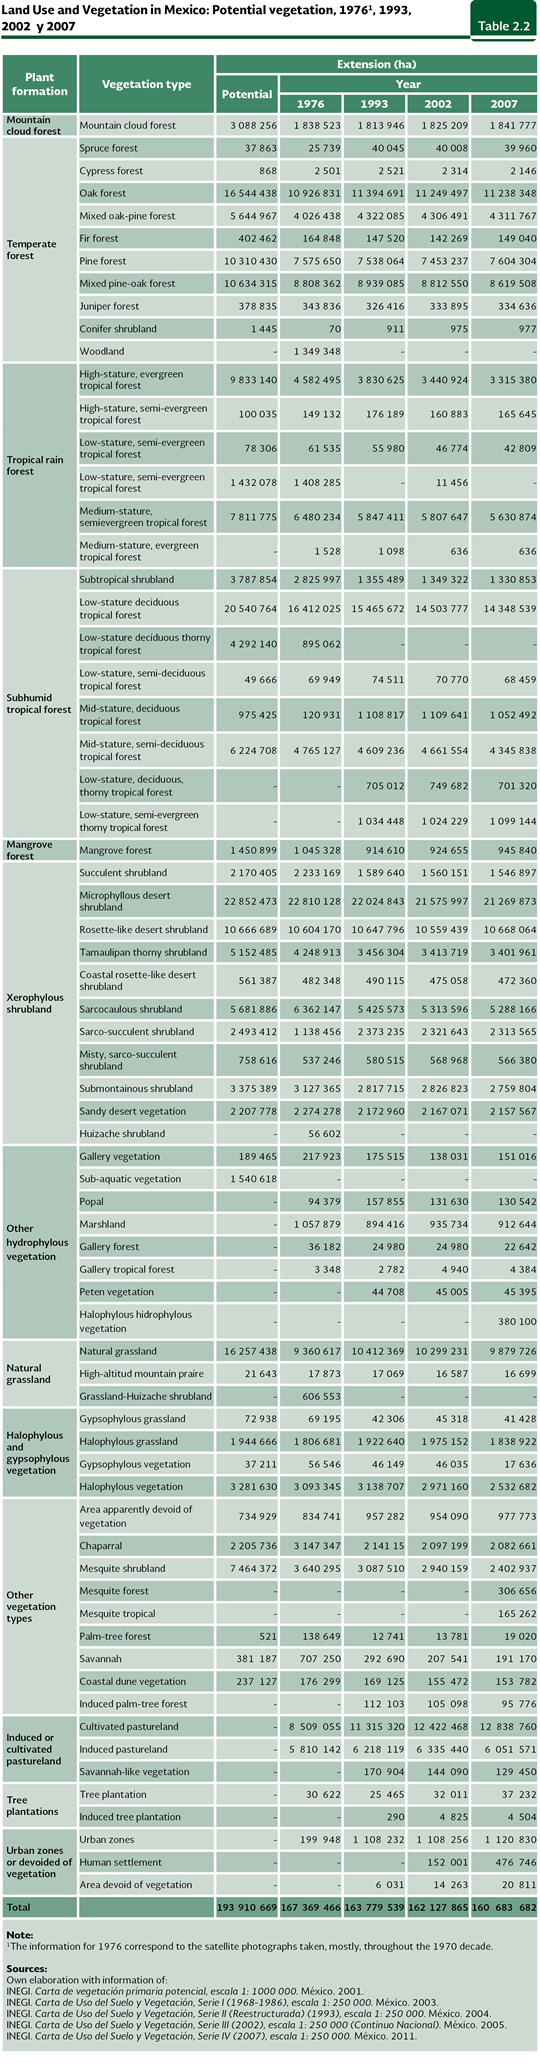
CHANGES IN LAND USE In the last 50 years, the human beings have transformed the world ecosystems faster and at a larger extent than any other period in history (see the Boxes The Transformation and loss of the world terrestrial ecosystems in the 2008 Issue of the Report and The natural vegetation and the road growth). It is fair to say that they have also been the reason of the release of a large amount of greenhouse gases into the atmosphere, which adds to the problem of climate change (see the Box Deforestation and GHG emissions). These fast and deep changes, with effects in some cases still known, have affected local, regional and global environmental processes, accelerating the biodiversity loss and causing the loss or deterioration of many environmental services such as water availability, climate and biogeochemical cycles regulation, among others. Land-use inventories have been elaborated in Mexico since some 40 years ago. However, these are not directly comparable, as these used different information sources (e. g. aerial photographs, satellite images, etc.), technological tools (e. g. paper maps, digital charts, geographical information systems, etc.) and several land-use classifications. Nevertheless, although quantitative estimates may not be sufficiently precise and should be interpreted with caution, the available information does reveal the existence of trends. Of the available land-use inventories, those most directly comparable are the Cartas de Uso del Suelo y Vegetación Series I, II, III and IV, scale 1:250 000, elaborated by the National Institute of Statistics and Geography (INEGI, in Spanish). Series I is based on the interpretation of aerial photographs taken in the 1970s, while Series II, III and IV were developed from satellite images recorded in 1993, 2002 and 2007, respectively. Separately, INEGI also elaborated the Carta de Vegetación Primaria Potencial at a scale 1:1 000 000, which describes the vegetation that likely covered the national territory before its transformation by human activities. According to the Carta de Vegetación Primaria Potencial (Map 2.5), shrublands comprised 29% of the territory, followed by tropical forests (28%) and temperate forests (24%; Figure 2.4). In the 1970s (according to the Series I) it was just kept 75% of the original area of temperate forests and, in the case of tropical forests, the figure was 69% (Figure 2.2). About thirty years later, in 2007, it was kept 73% of the original area of temperate forests, 58% of tropical forests, 90% of shrublands and 61% of natural grasslands, which mean a net loss of a little more of 23 million hectares of tropical forests, almost 13 million hectares of temperate forests, 5.5 million hectares of shrublands and nearly 6.4 million hectares of grasslands. Even though the largest part of such changes happened before the 1970s, in last decades there are still important losses (over 100 thousand hectares annually), particularly in the case of tropical forests and shrublands (Table 2.2).
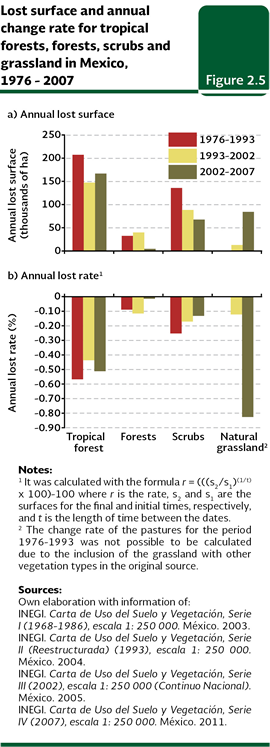
In the period between the 1970s and 19932, about 8.3 million hectares of natural vegetation were lost (equivalent to 5.5% of the remaining area) at an average rate of some 490 thousand hectares per year. Considering the total area lost, 3.5 million hectares corresponded to tropical forests (which changed at an average rate of some 206 thousand hectares per year), 537 thousand hectares to temperate forests (32 thousand hectares per year) and 2.3 million to arid shrublands (135 thousand hectares per year, Figure 2.5a). Tropical forests were the ecosystems that were lost more rapidly (at a 0.57% per year), followed by shrublands (0.26%) and temperate forests (0.09%; Figure 2.5b and IB 6.1-1).
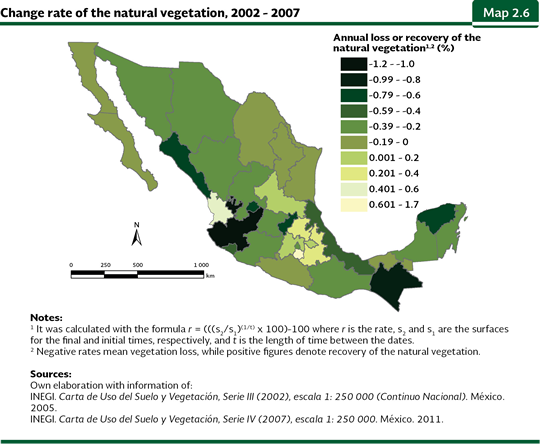
Between 1993 and 2002, little more than 3 million hectares changed from natural vegetation to other land uses; this figure is equivalent to an average loss of nearly 336 thousand hectares per year, which is lower than 1970s and 1993 figure. Plant formation that lost the largest area between those years were tropical forests, with about 1.3 million hectares (at 0.4% per year), followed by shrublands (about 796 thousand hectares at 0.17% per year), temperate forests (359 thousand hectares at 0.12%, higher rate considering the previous period) and natural grasslands (which lost about 114 thousand hectares at 0.12% per year; Figure 2.5). Recently, although the vegetation loss has decreased in some cases, losses were still important. Between 2002 and 2007, 1.9 million hectares of natural vegetation were lost at a rate of a little more than 382 thousand hectares per year (higher figure in comparison with that recorded between 1993 and 2002). Considering the total area lost, a little more than 835 thousand hectares were tropical forests, 419 thousand grasslands and 338 thousand shrublands. The case of temperate forests is outstanding because they lost 24 thousand hectares in this period, in other words, about 5 thousand hectares per year, this is about eight times lower than lost area per year between 1993 and 2002 (Figure 2.5). It is important to mention that such figures must not be confused with deforestation data reported by Mexico to FAO, because they are net losses of vegetation in different periods. Deforestation rates are described below. Between 2002 and 2007, the states which more rapidly lost their natural vegetation were Jalisco (1.1% annually), Chiapas (0.82%), Aguascalientes (0.78%) and Yucatán (0.77%; Map 2.6). In contrast, some states have recovered the natural cover: Hidalgo (0.2% annually), Puebla (0.37%), Nayarit (0.47%) and Morelos (1.68%).
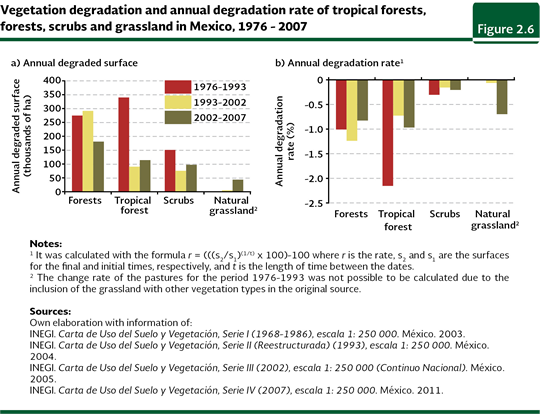
Besides vegetation clearing or the total elimination of the original plant cover to allocate the area to other land uses, another important process deals with the degradation of natural communities. For some periods, degraded areas surpassed the lost areas of some vegetal formations. For instance, between 1976 and 1993, about 16 million hectares of natural vegetation were degraded, this is, nearly twofold the natural area that was changed to other land uses in the same period. Tropical forests, temperate forests and shrublands jointly lost in those years about 13 million hectares of primary vegetation, which was equivalent to 16, 31 and 5% of their areas at the beginning of the period, respectively (Figure 2.6a). Notwithstanding, it must be said that the loss of the primary vegetation (both in net and relative terms) has decreased between the 1970s and recent dates. While between 1976 and 1993 940 hectares of primary natural vegetation were lost annually (at 0.8%), between 1993 and 2002 were 525 thousand hectares (0.51%) and in the 2002-2007 period were added 496 thousand hectares annually (0.5%).
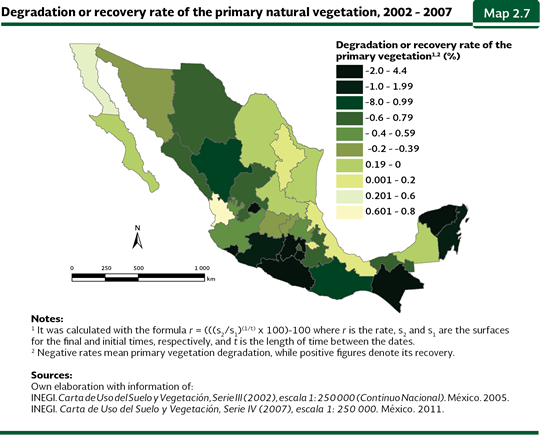
Between 2002 and 2007, the states where the primary natural cover was degraded more rapidly were Guerrero (at 4.4% annually), Colima (3.7%), Aguascalientes (2.9%), Morelos and the State of Mexico (each one at 2.2%; Map 2.7). In contrast, the primary cover was slightly recovered in Tlaxcala (at 0.03% annual), Nuevo León (0.1%), Veracruz (0.2%), Baja California (0.6%) and Nayarit (0.8%).
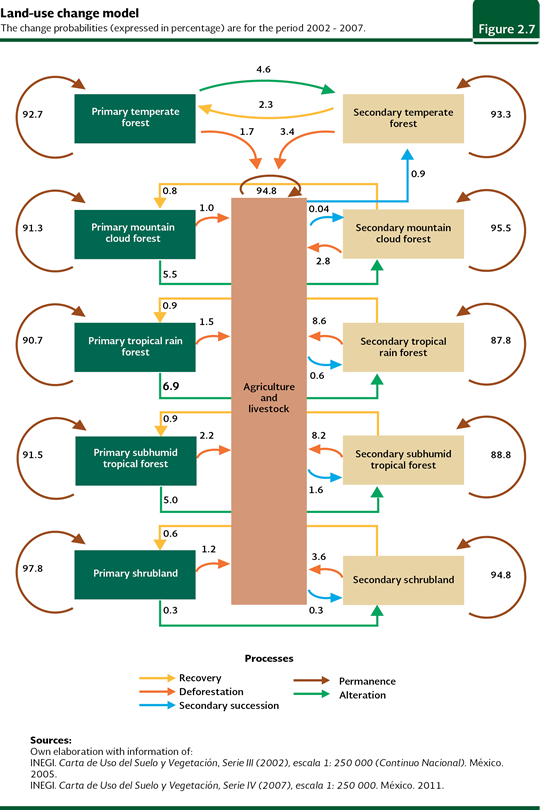
In general, tropical forests have been the country’s terrestrial ecosystems that have suffered the heaviest alteration by human activities in terms of the area cleared (a little over 23 million hectares), the remaining proportion of the original extension (nearly 58%) and the magnitude of disruptions (only 36% of current rainforests are primary vegetation). The case of the sub-humid tropical forest is particularly concerning due to a growing annual loss trend: little more than 43 thousand hectares between 1976 and 1993, 98 thousand hectares between 1993 and 2002 and 104 thousand hectares between 2002 and 2007. With respect to net lost area, tropical forests are followed by temperate forests, which have been reduced to nearly 13 million hectares and whose current extension reaches 73% of its original area. On the other hand, arid shrublands have reduced their extension from about 56 million hectares (their probable original extension) to 50.4 million. These losses are especially important considering that tropical forests and arid shrublands are the ecosystems containing most of the country’s biodiversity and, particularly, that arid shrublands concentrate a large amount of endemic species (refer to the Biodiversity chapter). By contrast, farming land has expanded steadily through time. In the 1970s, grasslands dedicated to cattle raising comprised an area above 14.3 million hectares, whereas cropland stretched over some 26 million hectares. From the 1970s to 1993, these anthropic uses grew in 6.35 million hectares to cover a total area of 46.6 million hectares in 1993, at a rate of 368 thousand hectares per year. From 2002 to 2007, cultivated or induced grasslands expanded in some 132 thousand hectares and, altogether, the areas dedicated to agriculture and cattle-raising grasslands rose in nearly 1.5 million hectares to reach a total extension of 51.1 million hectares. The transformation of vegetation to farmland is always more intense in the case of secondary vegetation relative to primary vegetation. This phenomenon of a first degradation or alteration of vegetation followed by the eventual transformation to other land uses is, undoubtedly, responsible to a great extent for the high rate of natural vegetation losses in Mexico. The dynamics of the transformation between different uses may be conceived as a flow of land passing from one land-use type to another, as shown schematically in Figure 2.7.
Nota: 2 The estimates of the change rates between the Series I and II of the Cartas de Uso del Suelo y Vegetación mentioned throughout the text must be taken with caution because it been considered as the year of the first one of them 1976, being this the actual date when they are attached a series of satellite photographs mostly taken along the decade of 1970.
|