| CHAPTER 1. POPULATION AND ENVIRONMENT |
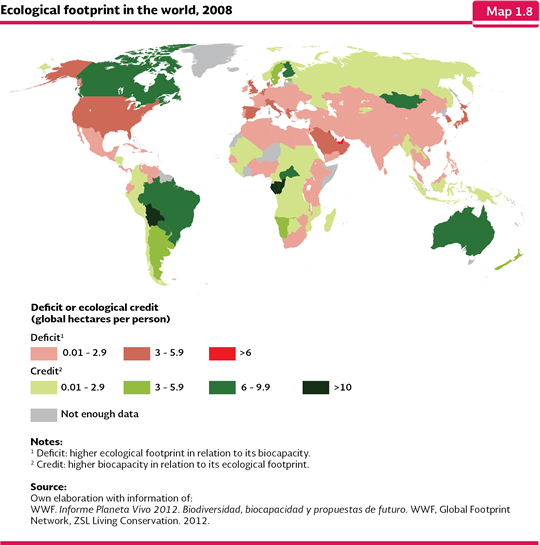
HUMAN ACTIVITIES AND ENVIRONMENT One of the forms where it has been evaluated the human pressure over the environment is through the called ecological footprint. This indicator may be interpreted as the human demand over the ecosystems in terms of the used surface for the agricultural, fishing, forestry production and for the fishing areas, as well as the area used for the infrastructure and human settlements and the surface required to absorb the carbon dioxide released by the fuel burning (WWF, 2012). The ecological footprint of an individual, from a country or worldwide is the total of the surface measured in global hectares11, used by each one of such components. The ecological footprint does not include the fresh water consumption because its demand and use cannot be expressed in terms of global hectares; notwithstanding, it is currently estimated through a similar proposal called “water footprint” (see the chapter about Water). The difference in global hectares between the ecological footprint and the biocapacity12of a country denotes the existence of a debt or an ecological credit of its natural resources. In 200813, the mankind ecological footprint was 18,200 million of global hectares, which means an ecological footprint per capita of 2.7 global hectares (WWF, 2012). If this value is compared to the biocapacity of the planet, that in that same year was 12,000 million of global hectares, or 1.78 global hectares per person, it is evident that, according to this indicator, it has already been surpassed the 50% of the planet capacity to keep the mankind in a sustainable way. In other words, it would be equivalent to say that by 2008 the world society needed 1.5 planet earths to keep its current consumption patterns, or that the overexploitation of the planet resources reached 50%, what clearly shows non-sustainability conditions. According to the Living Planet Report 2012 (WWF, 2012), if the same current rhythm is kept in the use of the resources, by 2050 the mankind would need 2.9 planet earths in order to meet its necessities. The ecological footprint per capita varies highly from country to country and from region to region. This is caused mainly by the population size, the consumption patterns, the efficiency (or inefficiency) of the productive processes (both in the use of the resources and in the emissions and waste that they produce) and the availability and the conditions of the territory. At a regional level, North America (the United States, Canada and Mexico) has the world biggest ecological footprint (6.2 global hectares per person), which contrasts with the 4.1 global hectares of its biocapacity, which yields a deficit of 2.1 global hectares per individual. The European Union is next, with an ecological footprint of 4.7 and a bio capacity of 2.2, which makes its deficit per person (2.5 global hectares per person) bigger than the North American region. The region with the lowest ecological footprint is Africa, with 1.4 global hectares per person and a biocapacity of 1.5, with which is ranked with just 0.1 global hectares to cover its biocapacity. South America has an ecological footprint of 2.7 global hectares per individual, however, it has the highest biocapacity at a world regional level (7.4 global hectares per person), and so it is considered that every inhabitant of the region has 4.7 global hectares as a reserve. In Mexico, every inhabitant has an ecological deficit of 1.9 global hectares, because our estimated footprint is 3.3 hectares and the biocapacity of 1.4 global hectares per individual. The ecological footprint of Mexico in 2008 took the 49th place in the ranking of the countries with over a million inhabitants (WWF, 2012; see the Box The ecological footprint of Mexico). In 2008, 100 countries recorded an ecological deficit (Map 1.8). In this group, there were 32 countries with a high income (more than 10 thousand dollars of GDP per capita yearly in the same year; as a reference, the value for Mexico was 9,843.414), but also countries with a low economic development with less than one thousand dollars of GDP per capita yearly (El Banco Mundial, 2012) This suggests the inadequate use of the natural resources is not necessarily related to the economic level of the countries.
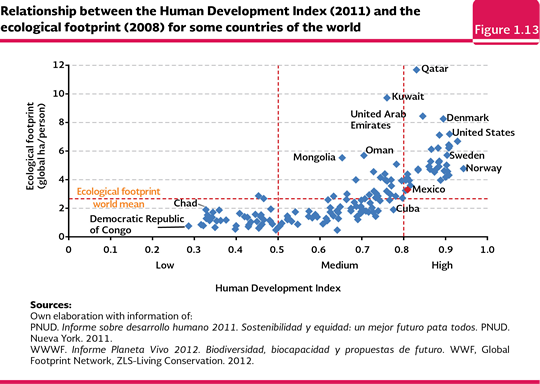
The relationship between the HDI and the ecological footprint shows that, in general terms, the countries with a high HDI (most recent data as of 2011) have ecological footprints over the world average bio capacity (1.8 global hectares per person in 2008), it means, they have an ecological deficit, which means their economic and social development is not reflected in a sustainable management of their natural resources (Figure 1.13). Mexico is in such situation, with an ecological footprint of 3.3 and an HDI of 0.8225 (reported value in the last national report, PNUD-México, 2011)15. The most extreme cases are Qatar and Kuwait, which have the biggest ecological footprints of the world (11.7 and 9.7 global hectares per individual, respectively). The first one is in the group of the countries with the highest HDI (0.831) and the second one, in the group of the countries of middle HDI (0.76). In the other side, the countries whose ecological footprint is below the world average availability (it means, they have an ecological credit) but their HDI is low, as it is the case of many countries located in the Sub Saharan Africa. There is a group of countries that have a high HDI (Norway, Australia, New Zealand, Canada, Sweden, Finland, Estonia, Lithuania and Chile) which have not surpassed the bio capacity of their territory; however, in all of the cases, their ecological footprint is higher than the world average. This suggests that the well-being of the population if these countries could be based not just in the exploitation of their own resources, but also in the importance of the products which are produced in other parts of the world and which are not accounted in their own ecological footprints. With the reported data, there is not a country in the world which has a high HDI and which is below the world average ecological footprint (Figure 1.13).
The issue of the environmental sustainability has taken such importance in the international agenda, that in the initiative of the Millennium Development Goals (MDG) created in 2000 and adopted by 189 countries, Mexico included, it was explicitly stated in the Goal 7, that it is necessary to involve the principles of the sustainable development in the national policies and programs and to revert the loss of resources of the environment. In this initiative, the environmental sustainability is in the same importance level of the other seven goals related to health, education and equality of the people. Although the original proposal of the MDG, the goals related to the environmental issue were very general, in 2007 there was a proposal to have an expansion that included issues such as the climate change (through the emission of greenhouse gases) and the protection to the biodiversity (for instance, endangered species or species at risk of extinction). This shows the acknowledgement of the importance of the environmental component as one of the pillars for the development of the societies. In fact, it is acknowledged that the possibility to fulfill some of the social goals (for instance, the reduction of some illnesses) requires a non-deteriorated environment (ONU, 2008). Notes: 11 It is defined as a hectare with the biological capacity to produce resources and to absorb waste no matter the country where it is located or if it is used by any ecosystem or by long ice blocks. 12 The biocapacity is the biologically productive area of agricultural land, prairies, forests and fishing areas which are available to meet the human necessities. The biocapacity of a country is determined by the type and the number of the biologically productive hectares within its border lines, as well as for its average yield. 13 Available most recent data published by the WWF in the Living Planet Report 2012. 14 Dollars to current pesos (El Banco Mundial. Available at http://datos.bancomundial.org/. Consult date: May 2012). 15 It is important to mention that if it is used the HDI value from 2011 published in the international report, Mexico is in the group of the countries with a middle HDI (0.77; PNUD, 2011).
|