| CHAPTER 1. POPULATION AND ENVIRONMENT |
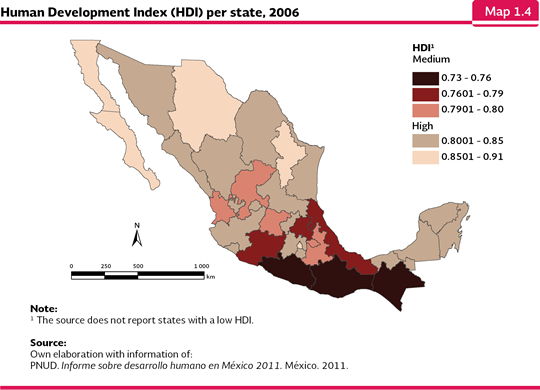
SOCIOECONOMIC DESCRIPTION OF THE MEXICAN POPULATION Just as in the same way the structure and geographic distribution of the population show an heterogeneity in the territory, its socioeconomic features also show important differences. It may be used a wide range of indicators to describe them, either economic, demographic, religious or political types. Among them, in this work, the Human Development Index (IDH), the Marginalization Index (IM) and the poverty situation were selected, because they summarize the income, health and education conditions the Mexican population has in all of the territory. Human Development Index (HDI) The HDI was developed by the United Nations Development Program (UNDP) and it measures the achievements in three basic dimensions of the human development: health (measured as the life expectancy at birth), education (average years of education and expected years of education) and income (measured as the gross national product per capita). In order to ease the comparison among the countries, from the World Report 2010, the geometrical mean of these three dimensions is calculated, resulting in a value between 0 and 1, being the values close to the unit indicators of a better condition of the population. With this index, the countries, states and municipalities may be ranked in a relative scale based on quartiles: the first quartile includes the countries with a very high IDH, the second one includes the countries with a high HDI, the third one includes the countries with a medium HDI level and the fourth one includes the countries with a low HDI (PNUD, 2011) The most recent international Report about the Human Development (published in 2011) reported the HDI in 187 countries. Mexico was placed in the second quartile with a value of 0.770, below Latin-American countries such as Uruguay (0.783) and Cuba (0.776), and above Panama (0.768) and Peru (0.725). Out of all the evaluated countries, the one with the highest HDI value was Norway (0.943), while the Democratic Republic of the Congo recorded the lowest value in the list (0.286; PNUD, 2011). The HDI value at a country level, however, does not show the heterogeneity which is carried within its territory, therefore this indicator is also calculated for other levels of the internal political division (e. g., states, municipalities or provinces) and even at the individual level, which allows a closer analysis of the particular circumstances of each country. For the particular case of Mexico, such index is generated at a national, state and municipality level, although, due to the availability of the data, it is published in different years than the international reports and it is updated less frequently. At the state level, the most recent HDI is for 2006 (PNUD-México, 2011) and at the municipality level, for 2005 (PNUD-México, 2008). Due to this temporary mismatch, the calculation methodology used in all of the publications carried out for Mexico so far is different from the one used by the UNDP at an international level which was described above. In the national reports, the HDI for Mexico is for the arithmetic mean of three indicators related to the access to health, education and income. The result lies between 0 and 1, and it allows to rank every state or municipality in the high HDI categories, (when they show values between 0.8 and 1), middle (between 0.5 and 0.79) or low (with values below 0.5; PNUD-México, 2011). The first HDI report about Mexico was published in 2003 with data from 2000. In that date, the national HDI was 0.8059, value that has slightly increased since then: in 2003, it was 0.8131 and in 2006, it reached 0.8225. In that last date, eleven states were ranked in the high HDI category and 21 states were ranked in the middle HDI, and not a single state was ranked in the low HDI category. The highest value was obtained by Distrito Federal (0.9099) and Nuevo León (0.8713) and the lowest ones were Chiapas (0.7336) and Guerrero (0.7513; Map 1.4; PNUD-México, 2011).
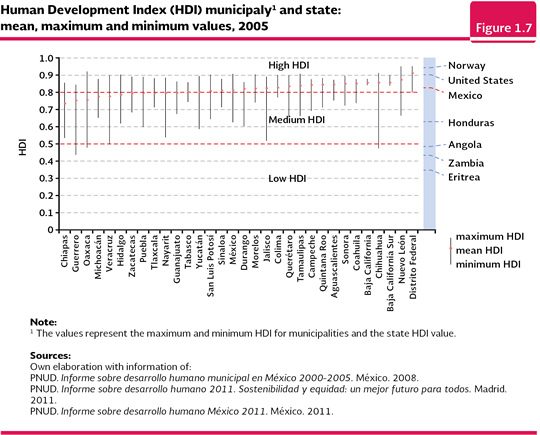
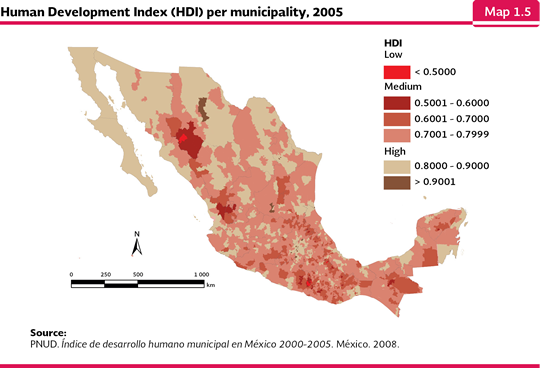
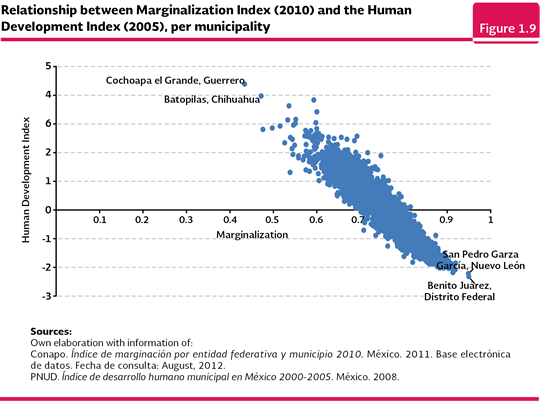
However, when the municipality analysis was done, there actually were municipalities ranked in the three categories. In the high HDI category there were 606 municipalities; in the middle category there were 1,844, and in the low category there were four. The two municipalities with the highest HDI were the Benito Juárez borough (0.9509) and San Pedro Garza García (0.95), being part of the states which obtained the highest IDH values (Distrito Federal and Nuevo León, respectively). However, the San Sebastián Tutla municipality was ranked in the third place (0.9204), in Oaxaca, which is outstanding since this state is ranked in the 30th place within the national HDI context and it holds one of the four municipalities with the low HDI (Coicoyán de las Flores, 0.4768). These results show that even within the political limits of one state, the population conditions show important contrasts (Figure 1.7) The other three municipalities which were ranked in the low HDI that year were: Tehuipango, Veracruz (0.4985); Batopilas, Chihuahua (0.4734) and Cochoapa el Grande (Guerrero, 0.4354; Map 1.5; PNUD-México, 2008).
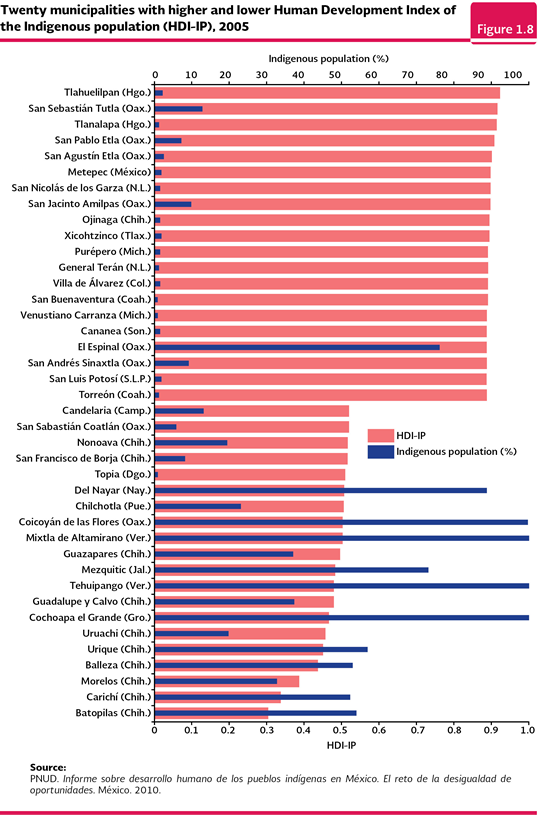
The methodology differences stated above with respect to the HDI calculation at an international and national level do not allow the strict comparison of the values of the states and municipalities in Mexico to the values obtained for other countries in the world. However, the mentioning of some of them could be used as a reference framework to show the contrasts and conditions where a part of the national population inhabits. While the municipalities with a high HDI are placed in the same rank as developed countries such Norway, the Unites States or Canada are, the ones with a low HDI are in similar conditions to countries from Sub-Saharan Africa such as Eritrea, Nigeria, Angola and Zambia (Figure 1.7; PNUD, 2011). The municipality HDI heterogeneity increases when the values are analyzed from the belonging of indigenous groups. According to the Census of Population and Housing 2010, in Mexico, there were 10.8 million people in households where the head of the household or the spouse speaks one of the indigenous languages5. The National Commission for the Development of Indigenous Peoples (Comisión Nacional para el Desarrollo de los Pueblos Indígenas; CDI) recognizes 25 indigenous regions in all of the Mexican territory, where 62 peoples inhabit them (CDI y PNUD, 2006) and over 60 original languages are spoken (DOF, 2008). That is why Mexico is considered as a multicultural and multiethnic country. According to the National Development Plan 2007-2012, “the rural and indigenous communities own over 80% of the ecosystems in a good state of preservation, where a great part of the biodiversity is found. Nearly 18 million hectares out of the 24 million hectares which are taken by the indigenous peoples are covered by natural vegetation. A half of the moist broadleaf forests and the cloud forests (mountain cloud forest and a quarter of the temperate forests are located in indigenous territories. In the high areas of the basins where indigenous communities are located, 21.7% of all the water from the country is collected” (Presidencia de la República, 2007). Due to the availability of the information, the most recent HDI calculation for the indigenous people in Mexico is from 2005 (PNUD-México, 2010). Its results show that out of the 2,032 municipalities taken into consideration in the calculation6, and where 99.9% of the indigenous population in the country was located in 2005, the indigenous population in eleven (0.54%) was below the 0.5 value, it means, the threshold that rates the low HDI. The indigenous population in 1,627 municipalities (80.06%) was placed in the middle HDI rank and 394 were in the high HDI rank (19.4%). However, within the latter, just five municipalities (0.25%) were ranked above the HDI 0.9. The indigenous population with the lowest HDI was located in the Batopilas (Chihuahua) municipality, with a value of 0.3011. In the most recent international HDI report, just two countries of the world are below this value: Niger (0.285) and the Democratic Republic of the Congo (0.286; PNUD, 2011). Batopilas belongs to the Tarahumara region, and along with other five municipalities in the same region which are also below the 0.5 limit in the HDI, make up a group of indigenous population which shows important lacks against the rest of the country. In the other side, it is found the indigenous population from the Tlahuelilpan municipality, Hidalgo, with an HDI of 0.9207, similar to the value reported for Australia (0.929) or the Netherlands and the United States (0.910). It is important to note, however, this municipality is not considered as indigenous7, since the percentage of the indigenous population which inhabits it hardly reaches 1.8% (Figure 1.8).
Marginalization Index The Marginalization Index (MI) ranks the population depending on their lacks regarding education, housing, income and distribution. Some of the indicators used in each one of these spheres are: about education, the percentage of the illiterate population of 15 years old or above, or people who have not finished the elementary education; about housing, the percentage of inhabitants in houses without drainage or with some level of overcrowding; about income, the percentage of the working population with income of up to two minimum wages; and about the population distribution, the percentage of the population which lives in localities of fewer than five thousand inhabitants. The Marginalization Index is calculated taking as a basis the indicators, which may have positive and negative values, in such a way that the higher the index value, the higher the degree of marginalization. The MI confirms the inequality shown by the HDI at a state and municipality level. In general terms, the municipalities with a lower HDI also have the highest degree of marginalization level (Figure 1.9). In 2010, 849 municipalities had a very high and high level of, marginalization level and 11.5 million (10.3% of the national population) people inhabited such municipalities. 42.4% of these municipalities are located in Oaxaca, state where 360 out of its 570 municipalities are ranked in these categories; the rest is distributed in other 21 states. It is important to mention that in the same year, in 10 states (Distrito Federal, Baja California, Baja California Sur, Aguascalientes, Coahuila, Colima, Morelos, Quintana Roo, Tabasco and Tlaxcala) there were not municipalities whose population were ranked in very high and high levels of marginalization (Conapo, 2011).
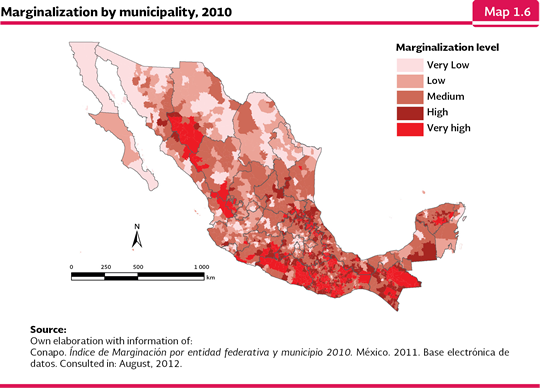
The municipalities with a middle level of marginalization accounted to 944, with 21.2 million people in 2010, it means, 18.9% of the national population. In this marginalization level, Oaxaca also had the highest number of municipalities (171), which means the 18.1% of the total of municipalities with a middle level of marginalization in the country. The low and very low marginalization categories included 663 municipalities, where 79.6 million people lived; it means 70.9% of the national population. In Jalisco, for instance, over half of the municipalities are ranked in the low and very low categories; in Baja California, its five municipalities have a very low level of marginalization; and in Distrito Federal, 15 out of the 16 boroughs got a very low level of social exclusion (just Milpa Alta was ranked in the low marginalization category; Map 1.6; Conapo, 2011).
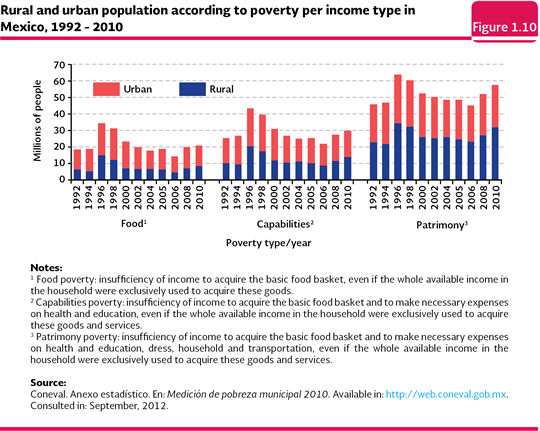
In 2010, the Cochoapa el Grande, Guerrero, municipality, was the political-administrative unit with the highest marginalization level in the country. It held almost 19 thousand inhabitants, 66.7% of them with 15 years old or above, was illiterate and 81.3% had not finished the elementary education. At the same time, 89.9% of the population inhabited houses without neither drainage nor a restroom. In that same year, in the opposite side, it was the Benito Juárez borough in Distrito Federal, where over 385 thousand people lived, there were less than one percent with 15 years old or above was illiterate and 3.1% had not finished the elementary education; in regard to housing, less than 0.02% of its residents inhabited houses without neither drainage nor a restroom and 0.01% did not have electric power. Just in the same way the HDI analysis shows great deficiencies in the attention to the indigenous population of the country, the MI reinforces such tendency. The Conapo estimated that out of the 441 municipalities of the country which showed a very high marginalization level in 2010, 218 were indigenous municipalities8 where 2.1 million people with 5 years old or more who were speakers of an indigenous language lived. On the other hand, there were not municipalities considered as indigenous which were in the low and very low marginalization levels (Conapo, 2011). Poverty The third indicator used in this report is the poverty condition. The General Law of Social Development (LGDS; for its acronym in Spanish) orders the National Council for the Evaluation of Social Development Policy (Coneval; for its acronym in Spanish) to carry out its measurement every two years at a state level and every five years at a municipality level using the information issued by the INEGI. Traditionally, the calculation was done from a one-dimensional perspective which took the income as an approach to the well-being of the population. Under this focus, an individual or a household is ranked in patrimony poverty when their income was not enough to meet the satisfiers such as housing, dress, footwear and public transportation for every member of the household. In the case of the capabilities poverty, it shows up when the income is lower than the necessary income to invest, at a very acceptable low level, in education, and health of every member of the family; and finally, the food poverty shows up when the income is not enough to acquire the basic food basket, even if all of the available income in the household is used exclusively for the acquisition of such goods (Coneval, 2007). Using such criteria, the Coneval estimated that in 2010, there were 57.7 million people in patrimony poverty, which meant 51.3% of the country population; a little bit over 30 million people (26.7%) in a situation of capabilities poverty, and 21.2 million people (18.8%) in food poverty (Coneval, 2012). It is important to note that such figures are not accumulative, because the people who are ranked in food poverty they are also included in the capabilities and patrimony poverty (Figure 1.10).
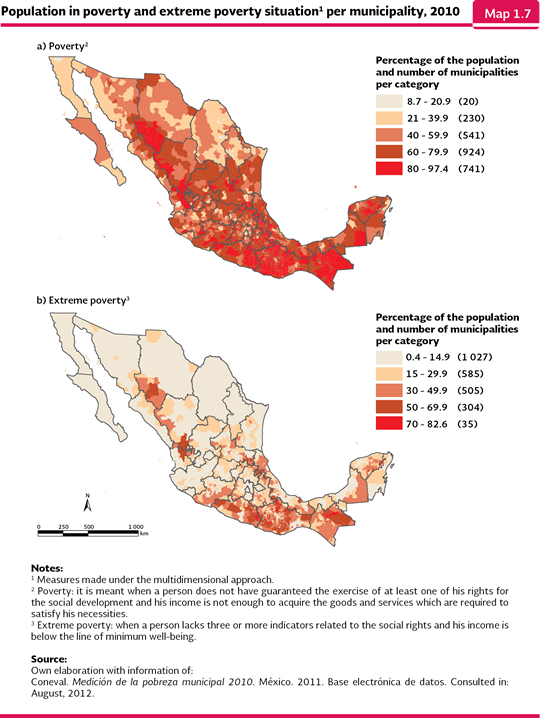
In an effort to include more elements which allowed a better evaluation of the poverty, the Coneval reconsidered the calculation method and it changed the one-dimensional vision of the income for a multidimensional one which considers the impossibility to enjoy several essential satisfiers, several of which are provided by the State (such as the access to sanitary services or public security), or which are considered as basic because they are part of the human, economic, social and culture rights (Coneval, 2011a and b). In 2011, the Coneval presented for the first time the results of the measurement of the multidimensional poverty for the 2,456 municipalities of the country based on the economic and social dimensions stated by the LGDS: income, education gap, access to health services, access to social security, quality, spaces and basic services in the household, access to food and the degree of social cohesion. Under the multidimensional approach, an individual is ranked in poverty situation when he does not have a guarantee to exercise at least one of his rights for the social development and his income is not enough to acquire the goods and services which are required to meet his necessities. One person is ranked in the extreme poverty situation when he lacks three or more indicators related to social rights and his income is under the minimum well-being limit9 (Coneval, 2010). With such criteria, in 2010, in Mexico, there were 52.1 million people in a poverty condition (46.2% of the population), 12.8 million people out of which were in extreme poverty (10.4% of the population). At a municipality level, in the same year there were 741 municipalities with 80% or above of its population in poverty condition, which means about 30.2% of the country municipalities. In this group, the ones with the highest percentage of the population in poverty were Mixtla de Altamirano, Veracruz (97%); Aldama and San Juan Cancuc, Chiapas (97.3%) and San Juan Tepeuxila, Oaxaca (97.4%). On the opposite side, there were 20 municipalities with less than 21% of their population in poverty situation, being the Distrito Federal, Benito Juárez borough (8.7%) and San Nicolás de los Garza (12.8%) and Guadalupe (13.2%) in Nuevo León, the ones which registered the lowest values (Coneval, 2011c; Map 1.7 a).
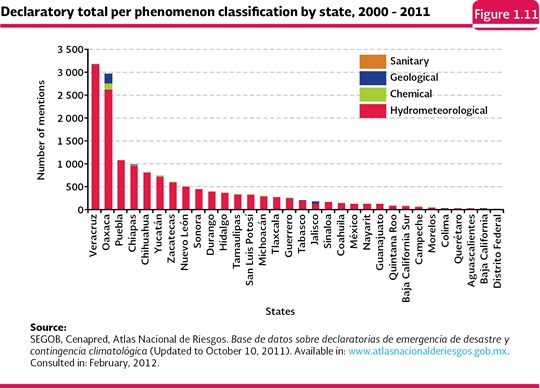
Taking into consideration the individuals in extreme poverty under the multidimensional approach, in 2010, there were, in Mexico, 35 municipalities with over 70% of their population in this condition (Map 1.7 b). Cochoapa el Grande, in the Montaña de Guerrero region, was the municipality with the highest proportion of individuals (82.6%) in extreme poverty. This municipality, established in 2002, holds about 17 thousand people over three years old who speak an indigenous language; it also took the last municipality place in the indexes of marginalization and human development described above. It’s back warding conditions contrast to the ones from the 1,207 municipalities and boroughs with less than 15% of its population in extreme poverty, ten out of them showed less than one percent of their inhabitants living under this condition. Population in environment risk areas Due to its geographic location, climate, orographic and water features, and the high volcanic and seismic activity, Mexico is exposed to the impact of different events of a nature origin: hydrometeorological phenomena (low temperatures, tropical cyclones, strong winds, floods, rains, snowfalls or hailstorms, droughts or tornadoes), geological (seismic and volcanic) and sanitary (red tide). It must be added the phenomenon directly caused by the human activities, such as some fires, leaks and spills of chemical compounds. All of these events, no matter their origin, may have negative consequences over the population, as well as in the infrastructure and the economy of the populations and damaged areas. Within this range of phenomenon, the hydrometeorological ones are the ones that cause the highest economic damage to the country: for instance, in 2009, 96% of the economic losses caused by disasters, which amounted to 14 billion pesos, were the result of their effects. Although this is a very important issue to determine their impact, the consequences of human nature are not minor: in that year, 100 people died and slightly over 550 thousand were damaged, among injured, evacuated and victims (Cenapred, SEGOB, 2010). The intense precipitations related to this kind of phenomena, along with the bad topography, the use of soil and the state of the vegetable cover may cause important damages which are overstated if there are not preventive and relief measures in vulnerable areas. After a kind of natural phenomenon has happened which damages households, services or infrastructure, the Secretary of Government (Secretaría de Gobernación; SEGOB) may issue a disaster dictum after it has been requested by the damaged state or by any government entity. This dictum has the objective to provide resources to rebuild the damaged infrastructure. It is also possible to issue emergency dictums, which are meant to attend the life and health of the population, as well as a dictum for climatic eventualities, designed to attend low income producers when there are atypical climatic eventualities, which are relevant, non-recurrent and unpredictable (Sistema Nacional de Protección Civil, SEGOB, 2012). In order to show the extent of the effect of the natural phenomena in the country, as well as their negative consequences, just between 2000 and 2011 there were about 15 thousand municipality records of dictums issued for any of the three types already mentioned. It is important to note that the publishing of just one written dictum (of any kind) in the Official Journal of the Federation may include more than one municipality. In this period, the states with municipalities which had a higher number of times in dictums were Veracruz (Nautla, 31 times and Minatitlán and Tecolutla, 29 times each one of them) and Oaxaca; the ones with the lowest figure were Baja California and Distrito Federal. On the other hand, 311 municipalities were included just once and 133 were not included in any kind of dictum. The dictums for hydrometeorological phenomenon were the ones with the highest percentage (92.3%) of the reasons for the dictums over the 2000-2011 period (Figure 1.11; Cenapred, SEGOB, 2012).
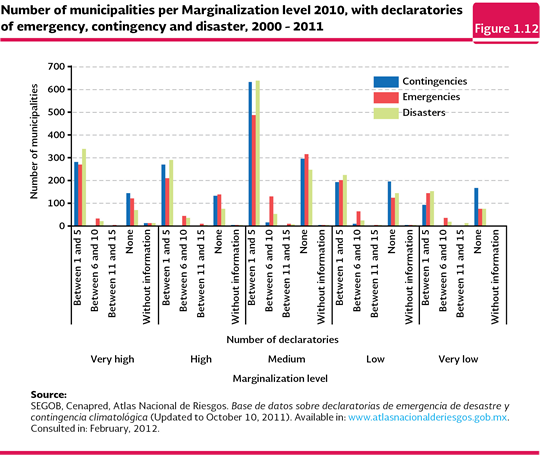
As the incidence of the municipalities in the dictums of disaster, emergency or eventuality is related to their socioeconomic variables, the result also shows that the municipalities with a high and very high marginalization level have suffered the effect of the natural phenomenon, which has made even more difficult the situation of their inhabitants (Figure 1.12). In extreme situations, the consequence of a continuous presence of natural phenomena may contribute to the fact that some sectors of the population make the decision to migrate, either temporarily or definitively, to settle in other places. Due to complexity of the migration phenomenon, as of today it is not possible to establish with certainty the number of people who have left their home place or residence for environment issues mainly; however, some studies have recorded such component would be contributing in an important way, to make people make such decision (see the Box Migrants for environment reasons).
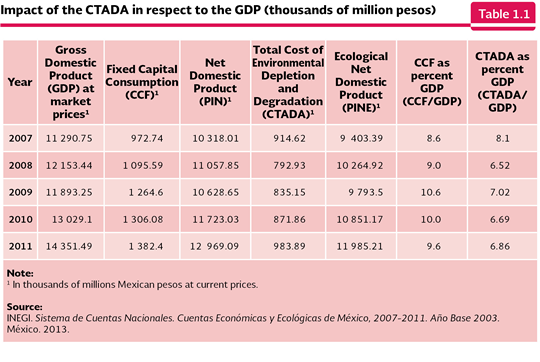
Economy and environment For a long time it was accepted that the environment damage was an unavoidable cost of the economic development of the countries and the environment problems would be attended once the economic and social problems were solved. The concern to keep the economic development left in a second level, frequently, the importance the environment costs caused by the economic activities would have in the short, middle and long terms. However, nowadays, the different sectors of the society are more aware of the negative effects, both economic and social, of the environmental degradation and the intensive and unsustainable exploitation of the natural resources. Since the economic growth is one of the components of the sustainable development and the environmental degradation has a direct effect on the sustained growth of the economy of any country, it is necessary to have information which may allow making an objective balance of the costs of the environmental degradation and the depletion of the natural resources, as well as of what is invested in protective actions and sustainable use of the natural resources. In Mexico, the INEGI has estimated the Total Costs of Environmental Depletion and Degradation CTADA; for its acronym in Spanish)10 of the country in the last years. The CTADA are calculated based on: 1) the depletion costs for the forest resources, the hydrocarbons (oil and natural gas), ground water and the derivatives for the depletion of the natural resources caused by the change of the soil use; and 2) for the costs related to degradation which include the ones related to the low air quality and the pollution degradation of the soils and water. The last available estimate of the CTADA is for the 2007-2011 period (published in 2013), and according to it, the cost went from 914.62 billion to 983.89 billion pesos in that period (Table 1.1; INEGI, 2013). Due to the changes in the calculation methodology, the information for different periods is not possible to be compared, although they allow knowing with a certain degree of confidence the extent of these costs over time. From the second half of the 1990 decade of the last century to 2011, the behavior of the CTADA as a proportion of the gross domestic product has shown variations among the years. Between 1996 and 1999, it was recorded a growing tendency: from 10.3% to 10.9% (INEGI, 2003); from 2000 to 2005, the tendency changed to a decrease until it reached 7.7% (INEGI, 2006 and 2011b), to go up again in 2006 and 2007 until reaching, in this last year, 8.1%. During the 2008-2011 period, with some variations, it has been maintained around 7%, which is still a very excessive high cost for the development of the country (Table 1.1.; INEGI, 2013).
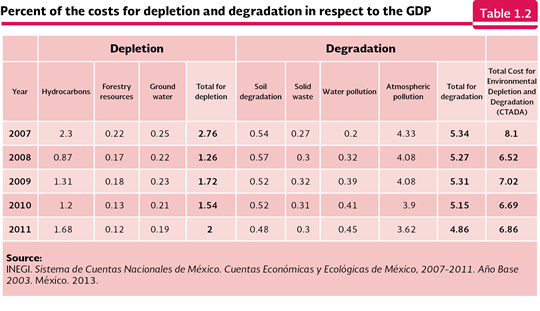
It is observed in the Table 1.2 that the highest share of the CTADA is caused by the degradation costs, which meant 4.9% of the GDP for 2011, being its principal component the costs related to the air pollution (3.62%). On the other hand, the depletion costs amounted to 2%, where the hydrocarbons meant the highest share (1.68%), being the 0.32% divided among the other components (Table 1.2).
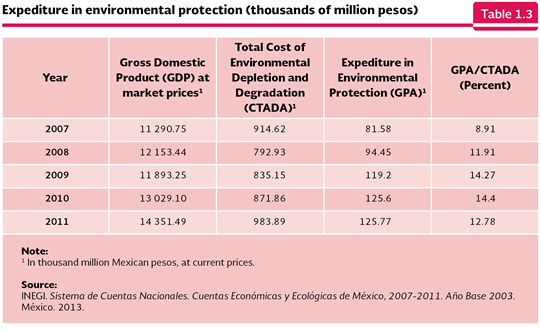
If the CTADA are compared to the expenses of the government for environment protection (Table 1.3), the unbalance is obvious between what is lost in terms of natural capital of the country and what is invested in its protection and restoration, in spite of the increase in the expenses of environment protection which have been made in the 2007-2011 period. In 2007, 81.58 billion pesos were invested (which meant 8.1% of the CTADA for that year), reaching 125.77 billion pesos for 2011 (12.78% of the CTADA; Table 1.3). In spite of the upward tendency, the expense for environment protection is still lower to the costs generated by the degradation and depletion of the natural resources, so it is evident the necessity to reduce the environment costs related to the development of the country.
In 2011, slightly more than half of the expenses for environment protection (51.2%) was dedicated to the remedying activities (for instance, the catching and treatment of wastewater, the collection and treatment of urban solid waste, and for the control, abatement and mitigation of the atmospheric pollution), followed by the administration activities for environmental protection (19.7%), the prevention activities (17.1%; for instance, biodiversity protection, environmental education and water and energy savings) and the research and ecology development (12%; INEGI, 2013).
5 The National Commission for the Development of Indigenous Peoples in México (CDI, for its acronym en Spanish) considers as indigenous people all of the people who are part of an indigenous household, where the head of the household, the spouse and/or one of the ancestors (mother or father, stepmother or stepfather, grandmother or grandfather, great-grandfather or great-grandmother, great-great-grandfather or great-great-grandmother, father in law or mother in law), stated being an indigenous language speaker. In addition, it also includes people who stated being and indigenous language speaker and who are not part of these households ( Comisión Nacional para el Desarrollo de los Pueblos Indígenas, 2012). 6 For the IDH-PI calculation, the source did not take into consideration the total number of municipalities that existed in the country in 2005 (2,454) because in 393 of them there were no indigenous population and in 29 the whole information was not available for the calculation. 7 According to the National Commission for the Development of Indigenous Peoples, a municipality is considered as a predominantly indigenous one when its population of this type means over 40% of the municipality total (CDI y PNUD, 2006). 8 The Conapo ranked the country municipalities in four categories determined by the proportion of the indigenous population settled: i) indigenous, where 79% or more of the population with five years old or more speak an indigenous language, ii) mainly indigenous, where between 40 and less than 70% speak an indigenous language, iii) with a moderate indigenous presence, where between 10 or less than 40% of its residents masters any indigenous language; and iv) with limited indigenous presence, where less than 10% is an indigenous language speaker (Conapo, 2011). 9 It is equivalent to the monetary value of the basic food basket issued by the Coneval, which includes among other products: corn, beans, eggs, rice and vegetable oil. 10 The CTADA (Total Costs for Depletion and Environmental Degradation) are equivalent to the expenses the whole society would have to make in order to heal, restore and/or prevent the damage to the environment as a result of the activities of the human being, such as production, distribution and consumption of the goods and services (INEGI, 2011d).
|