| CHAPTER 1. POPULATION AND ENVIRONMENT |
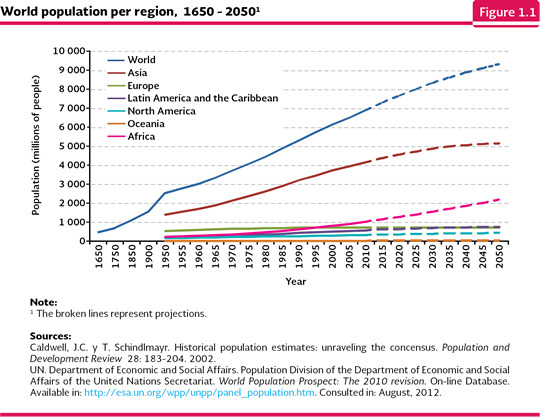
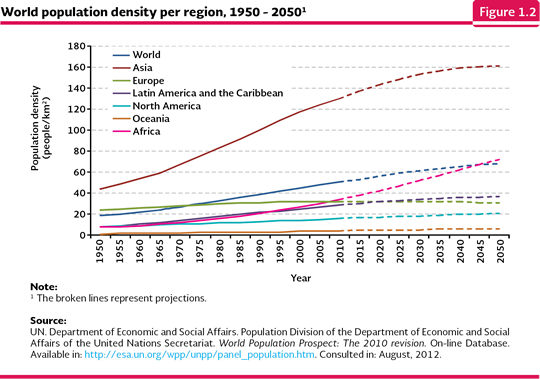
Humankind, from its origins, has kept a close relationship with nature. From nature, it has obtained, throughout history, food, fuel, medicine, and other kinds of materials, in addition to raw material to manufacture clothing, housing and other types of infrastructure, among many other products. However, in spite of the value the nature capital has for the society, the utilitarian vision of the environment has steadily turned forests, rainforests and other natural ecosystems into land for cattle, agriculture and urban areas; water from rivers, lakes and seas are now polluted and their fishing resources are overexploited; large quantities of solid and liquid waste are directly deposited in the soil or water and the burning of fossil fuel produces large quantities of gas that goes into the atmosphere. All of these issues have caused, besides the environment deterioration, important affections to the human population. The benefits we freely obtain from nature are referred to as environment services (see the Box Ecosystems environmental services and human well-being). Such services are not always local in the sense that the ecosystems that provide them are not located in the same site from where the benefit is obtained: for instance, water that supplies some human centers (either aquifers, rivers or lakes) may be originated from the infiltration that happens in well conserved forests located many kilometers away from the human centers. It is common that in places with a high nature capital, the population well-being is low in relation to income, education and health, which increases the pressure to overexploit and deteriorate the ecosystems and its environment services in order to meet the immediate population necessities. The narrow relationship that happens among the environment services, the development, the culture and the marginalization is so important that the protection and the sustainable use of the nature ecosystems goes beyond the strict environmental sphere, which has caused to be included in the social, economic and health agenda of the different world governments. In this context, the intention of this chapter, more than making a deep review of the dynamic structure of the world and Mexican population1, it is to describe some of the most important features which are directly related to the environment both at national and global levels. The human population is the most important agent of pressure over the ecosystems, but at the same time, it is the element capable of implementing possible solutions for the deterioration as well as the preservation actions of the biodiversity and the environment services. World population The fast growth of the world population is a relatively recent phenomenon. According to some estimates, from the beginning of our era to the year 1000, the population was under 300 million people, but just 500 years later; the inhabitant number had grown, according to some estimates, to between 424 and 484 million people. In 1750, that amount had already grown about 200 million people amounting to 700 million people. By the beginning of the Twentieth Century, this population had grown two folded amounting to about 1,550 million people (Caldwell and Schindlmayr, 2002). However, the fastest growth started in 1950, mainly boosted by the increase in the birth rate and the decrease in the mortality rate (due to a higher use of vaccines, antibiotics and insecticides) in the underdeveloped world regions. Such growth tendency was steady and by the end of the Twentieth Century, the six billion people had been surpassed and at the end of 2011, the planet hosted seven billion people. The UN Population Division estimates that the world population will continue growing up to reaching over nine billion people in 2050 (UN, 2012; Figure 1.1). The contribution to this growth from each world region has important differences. For instance, in Asia, the population growth has been very high: in 1950, there were 1,403.4 million people; in 2010, 4,164.2, and it is expected that by 2050, 5,142 million people inhabit this world region. In Latin America and the Caribbean, in 1950 there were 167.4 million people, in 2010, 590.1 million people and by 2050 it is estimated there will be about 751 million people. These figures may make more sense if they are expressed in terms of population density in the available territory. In Asia, the population density in 1950 was 44 inhabitants per square kilometer; in 2010, it was 130 inhabitants per square kilometer; and by 2050, it is expected it will be 161 inhabitants per square kilometer; meanwhile, for Latin America and the Caribbean, in 1950 and 2010 there were 8 and 29 inhabitants per square kilometer, respectively, and it is expected that by 2050, it goes to 37 inhabitants per square kilometer (Figure 1.2). At a world level, in 1950, the average density was 19 inhabitants per square kilometer, in 2010, 51 inhabitants per square kilometer was reached, and it is estimated that by 2050, it reaches 68 inhabitants per square kilometer.
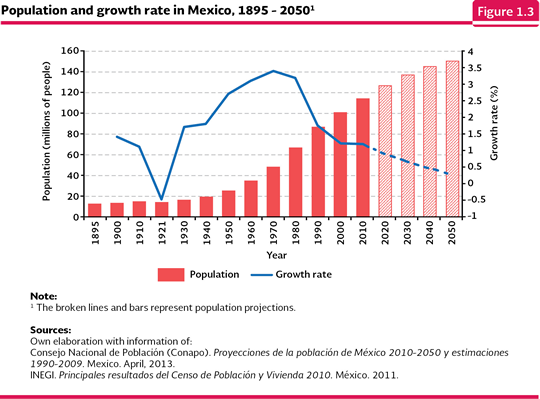
The population growth has brought about a higher demand of natural resources, what seriously press its reserves in nature. For instance, in order to meet the requirement of food for both the human and animal use, the agricultural sector currently uses 11% of the earth surface and the 70% of the water extracted from the aquifers, rivers and lakes, which makes it the biggest user of the world natural resources. In the past 50 years, the cultivated surface of the planet grew 12%, figure that is more relevant if it is considered that the FAO has estimated that in order to meet the necessities of the population it would be necessary to increase the world food production 70% by 2050 in relation to the 2009 levels (FAO, 2011). In regard to stockbreeding, the pasture areas use 26% of the earth ice free surface; in addition to this, the fodder production for cattle uses 33% of the agriculture farmland (FAO, 2009). In addition to the pressure to produce food, many of the mankind activities cause a great amount of pollutants that reach the atmosphere, the soil and the water bodies, deteriorating the ecosystems even more. For instance, in 2010, each inhabitant in the planet emitted an average of 4.44 CO2 tons, the principal gas causing the global warming (see the chapter Atmosphere in the section of Climate change), with big differences among countries though: an inhabitant in the United States emitted and average of 17.3 tons; one inhabitant from Mexico emitted 3.85 tons and one from Ethiopia, juts 63 kilograms (IEA, 2012). In regard to the generation of urban solid waste, in 2010, an inhabitant from the United States produced an average of 720 kilograms, while one from Mexico, 370, and one from China, 250 kilograms (OECD, 2013). Mexico has not been apart from neither the world population growth nor to the impact of the population in the environment. At the beginning of the twenty first century, the national growth rate was 1.2%, very similar to the rate at the beginning of the twentieth century, but with a population between seven and eight times bigger. In 2010, there were 114.26 million people living in the country: 51.2% was women and 48.8% was men (Conapo, 2013). According to the national population growth indicators, the Mexican population is in an advanced phase of demographic transition, where both the mortality rate and the birth rate tend to lower figures. The estimates from the National Population Council (Conapo; for its acronym in Spanish) show the population growth will continue up to 2050, when it will reach about 150.84 million of inhabitants (Conapo, 2013; Figure 1.3).
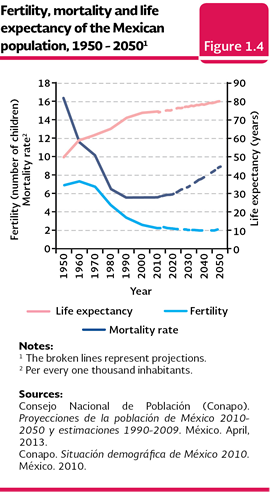
The estimated behavior of the Mexican population will be a consequence of several factors, among which the tendency in the decrease of the birth rate is highlighted which started over 30 years ago; while the average number of children per woman was 6.8 in 1950; in 2010 it was just 2.28. The effect of the gradual increase of the mortality rate from the first years of the twenty first century must be added to the former, because it is expected to move from 5.6 per every one thousand inhabitants to 6.7 in 2010 and 8.8 per one thousand inhabitants in 2030 and 2050. Additionally, the increase in the total life expectancy of the population has been very related to the improvements in public health, which have allowed an increase from 49.7 years in 1950 to 74 in 2010 (71 years for men and 77 for women). The estimates show that the total life expectancy could reach 77 years in 2030, and 79.4 in 2050 (Figure 1.4).
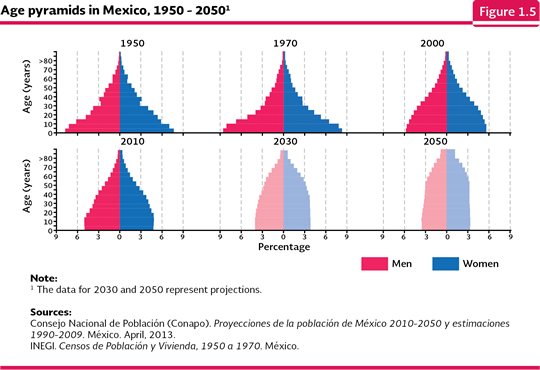
Another important aspect of the country demography is the change in its structure. Nowadays, the proportion of children in the population tends to decrease and the proportion of young and old people tends to increase: while in 2000, the proportion of preschool boys and girls (0-4 years old) was 11.5%, in 2010, it decreased to 9.8%; on the other hand, the old people over 65 years old moved from 5.2% to 6.2% of the population in the same period (Figure 1.5). In the case of the population in the productive age (between 15 and 64 years old) moved from 59% to 62% of the population between 2000 and 2010. Another indicator showing the same changes is the population middle age, it means, the age that divides in two equal parts the country inhabitants; in 1990, it was 20 years old, in 2000, it was 22 years old and in 2010, it reached 26 years old.
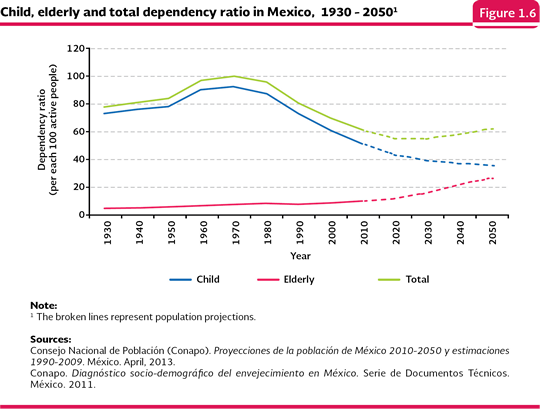
The current demographic transition of the country generates a positive relationship between the population of the dependent ages (children and elderly) and the productive population. This relationship is measured by the called dependency ratio calculated as the quotient between the population in the dependent ages and the productive age: in 1970, the number of dependent people was 99.7 per every 100 productive ones, and for 2010, it was estimated in 60.8 dependent people per 100 productive people (Figure 1.6). If the number of child dependency and the elderly dependency are analyzed separately, it may be observed that the child dependency has followed a decreasing tendency in contrast to the elderly people population whose dependency reason went from 7.7 to 9.9 per 100 people in productive age between 1990 and 2010.
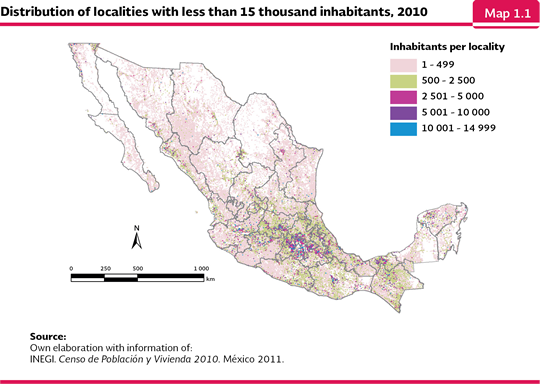
It is estimated that the lowest value of the demographic dependency ratio will be reached around 2025, to later increase as a result of the growth of the old people population. This is the called demographic bonus that the country has right now and it will even expand for some more years, which means a great intellectual and labor potential that may be used for the development of the country. Geographic distribution of the population in Mexico The current geographic distribution of the Mexican population portrays a large concentration of people in a few cities and areas, but also by a large amount of localities3 with a population of under 2,500 inhabitants scattered all over the national territory. The proportion of the population which inhabits rural localities (under 2,500 inhabitants) has dramatically decreased. In 1900, about 72% of the population inhabited in rural localities; by 1960 this percentage was slightly lower than 50% and in 2010, just 23.2% of the country inhabitants were located in localities of this category. This means that in a little over a century, Mexico turned from a mainly rural country to a urban one. In relation to the number of localities, in 2010 there were recorded about 170 thousand of the rural type (88.6% out of the total localities at a national level), 15.3% of which did not have roads (neither paved nor dirt) which may allow them to connect to other bigger population centers (INEGI, 2011c; Map 1.1). This isolation condition add, among other factors, to the high marginalization and poverty rates, since it makes the coverage of the basic services difficult such as education, health, drinking water, sanitation, electric power and telephony, in addition to lowering the employment and social mobility options.
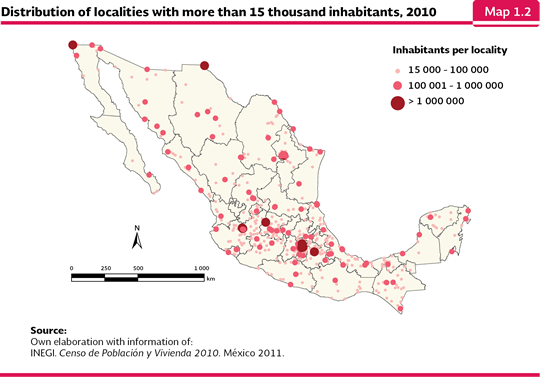
In regard of the urban population, in 2010, it was organized in 630 localities: 499 with between 15 thousand and 100 thousand inhabitants (where 15% of the country population inhabited), 120 with between 100 thousand and one million inhabitants (where near 35% of the population inhabited) and eleven localities with over one million inhabitants (where 13.2% of the population inhabited). In total, 62.5% of the national population inhabited these urban localities (Map 1.2; INEGI, 2011a).
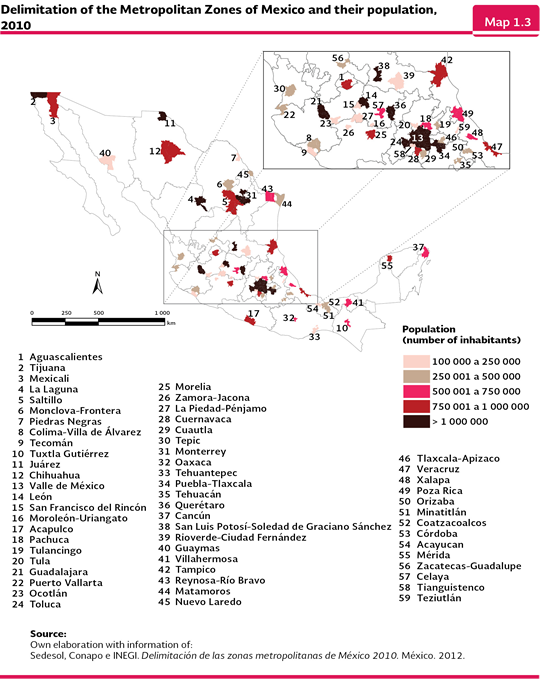
The metropolitan areas4 have been defined within the Mexican urban populations from the interaction of whole towns which share, in addition to geographic boundaries, a large socioeconomic activity. By 2010, Sedesol, Conapo and INEGI defined 59 areas of this type in the country. In that year, 56.8% of the national population (63.8 million people) inhabited these metropolitan areas, which, as a whole, took 8.7% of the territory (171,817 km2; Map 1.3). Among them, the Valley of Mexico Metropolitan Zone (VMMZ) is the most populated one, with a little over 20 million people, which is equivalent to 17.9% of the country inhabitants or 31.5% of the people established in all of the metropolitan areas of the country. The VMMZ is made up of the 16 Distrito Federal boroughs, 59 municipalities from the State of Mexico and a municipality from Hidalgo. In the second and third place are placed the Guadalajara (made up of 8 municipalities) and Monterrey (13 municipalities) metropolitan areas, with 4.4 and 4.1 million inhabitants, respectively. The least populated metropolitan area is Moroleón-Uriangato located in Guanajuato, made up of the two municipalities that provide its name, with about 109 thousand inhabitants, less than 0.1% of the national population in 2010.
The concentration of the population in the metropolitan areas has as a consequence high pressures over the environment, which may go beyond, many times, the limits of its own human settlement and its surroundings. For instance, in order to meet the water demand in the VMMZ, in addition to the supply that comes from the aquifers from the metropolitan area itself, it is required water which travels through the Cutzamala system and which may come from dams located in the Michoacán state (e. g., El Bosque and Tuxpan). Likewise, one part of the generated sewage water has an impact on distant areas: one part is sent to neighbor regions which have a little availability of the liquid (for instance, the Valle del Mezquital, Hidalgo), where it is used for the irrigation of agriculture fields.
Notes: 1 The information about the world population may be consulted in the website of the United Nations Population Fund (www.unfpa.org), and about Mexico in the website of the Conapo (www.conapo.gob.mx) and the INEGI (www.inegi.org.mx). 2 Due to the date and the level (locality, town or state) when the country demographic data is published, in this section (Population in Mexico) the Population Estimates in Mexico 2010-2050 were used (Conapo, 2013). In the following sections, the data is taken from the Census of Population and Housing, 2010 (INEGI, 2011a y b). 3 According to INEGI (2011b) a locality is a place which is taken by one or more houses, whether inhabited or not, recognized by a name given by the law or the custom. The rural localities are made up of fewer than 2,500 inhabitants, the mixed ones or the ones in transition, between 2,500 and 14,999, and the urban ones, from 15 thousand up. 4 The metropolitan area is defined as the conjunction of two or more towns where a city with 50 thousand or more inhabitants is located, whose urban area, functions and activities go beyond the limit of the town that originally held it, adding as a part of itself or its direct influence over neighbor towns, mainly urban ones, with which it has a high level of socioeconomic integration. This also includes the towns that due to their features they are relevant to the planning and for the urban policy, and it also includes a city with one million or more inhabitants, as well as those with cities of 250 thousand inhabitants which share co-urbanization with cities from the United States (Sedesol, Conapo e INEGI, 2012).
|