 |
| 1.2-5 | |||||
| GLOBAL TEMPERATURE CHANGES |
|
JUSTIFICATION
The increase in global mean temperature, associated with climate change, has affected hydrological systems and terrestrial and marine ecosystems in many parts of the world, including Mexico. Some of its effects are evident in the greater frequency, persistence and intensity of El Niño phenomenon; changes in precipitation patterns; droughts and contraction or expansion of the distribution ranges of different species, among others.
SITUATION / TREND
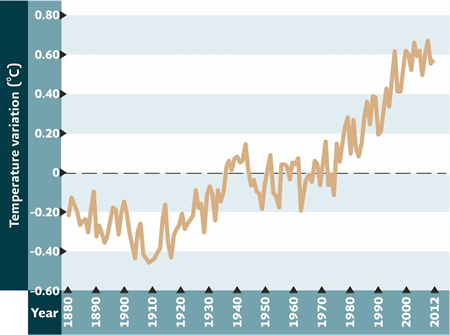
Notes:
1) Zero represents the mean temperature over thirty years (1951-1980), so data refer to annual variation around that mean value.
2) The time series displays the combined record of global terrestrial and sea surface temperature.
SUPPLEMENTARY INFORMATION
No supplementary information.
COMMENTS ON THE INDICATOR
Some international initiatives (e.g. Environment Canada, EEA and EPA) use this indicator. Temperature variations provide more information than absolute temperatures; for example, the former indicate how much colder or warmer a place is relative to the average condition.
SOURCE
NASA. GISS Surface Temperature Analysis. Global Annual Mean Surface Air Temperature Change. Global Land-Ocean Surface Temperature Anomaly (Base: 1951-1980).2012. Available in: http://data.giss.nasa.gov/gistemp/graphs_v3/
Accessed: September 2013.
![]()