2. Conceptual frameworks for environmental indicators
The topic of environmental indicators has been addressed by a number of institutions, with different concepts, objectives and scope, which has led to confusion, especially in new developers. The aim of this document is not to give rise to an in-depth, detailed discussion on the theoretical and practical approaches related to indicators; instead, this section intends to introduce the basic tools to take into account for developing a homogeneous, harmonious and useful system. Interested readers will find useful references on this subject in the Further reading section.
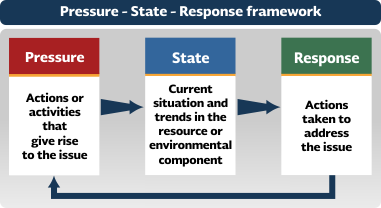
Since the information used to construct environmental indicators is broad and diverse, a conceptual framework is required for structuring the information and improving access and interpretation. There are several models for organizing sets of indicators. One of the best known models, and perhaps the most extensively used in our country, is the so-called Pressure-State-Response (PSR) proposed by Environment Canada and the OECD (OECD, 1993). Other models are the Driving forces-Pressures-State-Impacts-Responses (DPSIR, for its acronym in English) and those characterized by their thematic focus. A brief description of some of them is provided below, with focus on the PSR scheme, which supports the Mexico’s Core Set of Indicators of Environmental Performance.
2.1. Pressure-State-Response (PSR) framework
The PSR framework is based on causality: human activities impose pressures on the environment and change the quality and quantity of natural resources (state). Likewise, society also responds to these changes through environmental, economic and sector policies (responses) (OECD, 1993). This model is developed from simple questions:
- What is affecting the environment?
- What is happening with the state of the environment?
- What are we doing about these issues?
Importantly, although this is a logical scheme in terms of the relationship between pressures, state and actions, it suggests a linear relationship of the interaction between human activities and the environment, which is generally not true and hides the complexities underlying these interactions. In this framework, indicators are classified into three groups: pressure, state and response.
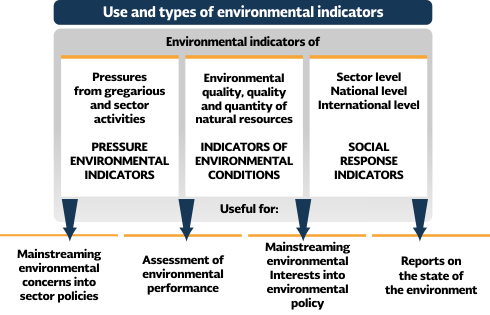
2.1.1 Pressure indicators
These describe the different pressures imposed by human activities on the environment and natural resources. An example of an air-quality pressure indicator is the emissions of polluting gases to the atmosphere.
Pressure indicators are classified into two groups: the first one considers direct pressures on the environment, often caused by human activities, such as volume of waste generated and pollutant emissions. The second group takes into account human activities themselves, i.e. conditions of activities –either productive or not- that give rise to environmental issues; for instance, the evolution and characteristics of motor car fleets. The latter are called indirect pressure indicators and provide elements to foresee the evolution of the problem; these are also useful for defining actions and environmental policies to be implemented by the relevant sectors to reverse the problem.

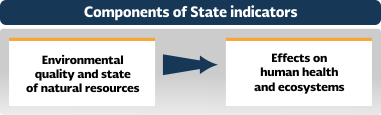
2.1.2. State indicators
These refer to environmental quality and to the quantity and state of natural resources. Examples of these include air or water quality, as evaluated through pollutant concentrations and the amount of natural resources (for example, area covered by forest). State indicators should be designed to provide information on the state of the environment and its changes over time. This type of indicators also considers the effects of environmental degradation on human health and ecosystems. To note, these indicators are generally objects of environmental protection policies.
2.1.3. Response indicators
These indicators denote the efforts made by society, institutions and governments to reduce or mitigate environmental degradation. In general, response actions are directed towards two objectives: i) pressure agents, and ii) state variables. Taking the decline of sea turtle populations as an example, response indicators could include both the progress made in installing turtle-excluding devices in shrimp-fishing vessels (response to pressure), and the results of turtle breeding and release programs (response to resource deterioration).
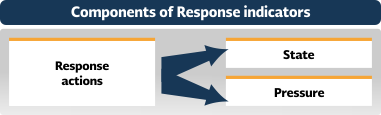
Some response indicators are often also considered as state indicators. For example, the area covered by protected natural areas gives an idea of efforts made to preserve the environment and, at the same time, is related to the extent of conservation of biodiversity.
Response indicators are more diverse and specific than the previous ones, since these describe highly specific situations. For this reason, unlike state indicators, there is not much experience to assess their empirical reliability. Furthermore, response indicators are often not quantitative, at least in principle. For example, to address the depletion of the stratospheric ozone layer, a response is simply signing a commitment to reduce the production and emission of ozone-depleting substances, such as the Montreal Protocol.
2.2. Driving Force-Pressure-State-Impact-Response Framework
This model, also known as DPSIR (Driving Force-Pressure-State-Impact-Response) is a derivative from the Pressure-State-Response model. Driving Force Indicators relate to human activities that generate pressures (in other models, indirect pressures); state indicators are limited to the state of environmental resources; impact indicators display effects on human health or ecosystems. The interaction between these elements is schematized in the following figure, using transport as an example.
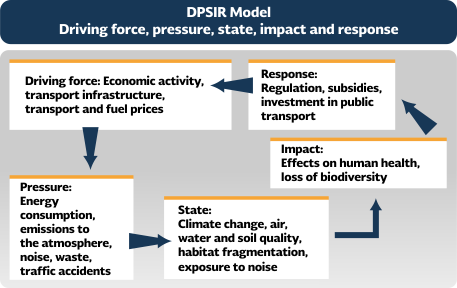
This framework also assumes a causal relationship between the various components of social, economic and environmental systems. Another example, using DPSIR to describe water quality, is:
• Driving force: Industrial production.
• Pressure: Volume of wastewater discharged into a water body.
• State: Water quality in the river, lake or water body involved.
• Impact: Water unsuitable for drinking (impact on the economy), persons with gastrointestinal disorders (health impact), loss of species (impact on the ecosystem).
• Response: Plants for sewage treatment and protection of water bodies.
The Canadian Ministry of the Environment (Environment Canada) uses a model very similar to DPSIR, which considers human activities as an indirect pressure, environmental conditions as state and effects (e.g. on human health and wildlife and infrastructure, among others) as impacts.
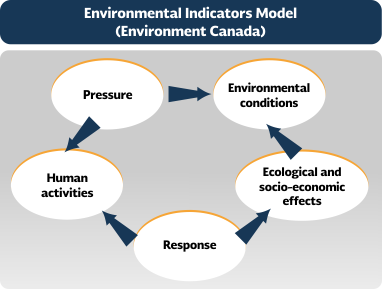
Source: Environment Canada. National Environmental Indicators Series. 1997.
While the lastt two models show environmental phenomena and the relationships between them in a more disaggregated way compared to the PER framework, they often lose simplicity and communication ability. Generally speaking, when the indicator system aims at a thorough understanding of issues and sufficient information is available, it is feasible to use either the DPSIR scheme or the one by the Canadian Ministry of the Environment; a disadvantage is that, in many cases, it is difficult to establish a causal relation with human health and/or ecosystems.
2.3. Sectoral indicators framework
Unlike the previous models, which try to describe the logical relationship between causes, consequences and responses, other schemes seek to integrate indicators in a way that more clearly shows the relationship between environment and economic activities. For example, the OECD developed an alternative conceptual framework, derived from PER, aimed at improving the integration of environmental considerations into sectoral policies. These indicators may not be strictly environmental, but are included in this context because they describe the relationship between economy and environment. Sectoral indicators have been organized within a conceptual framework that includes three types (OECD, 1998):
• Indicators showing environmentally relevant trends and patterns of the productive sector (indirect pressure indicators or driving forces in other schemes).
• Indicators that denote the relationship between a given productive sector and the environment, including positive and negative aspects of the sectoral activity, as well as effects of environmental changes on the sectoral activity.
• Indicators that reflect political and economic aspects and their relationship with the environment.
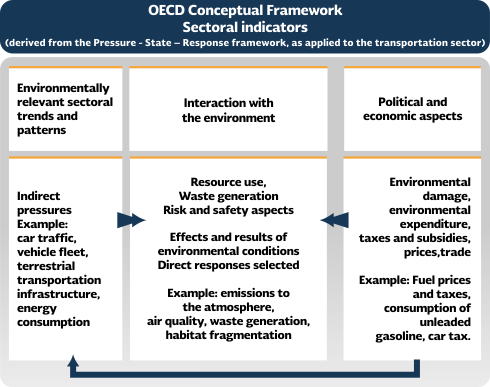
Source: OCDE. Environmental Indicators. Towards Sustainable Development. Paris. 1998.
Another framework, used by the US Environmental Protection Agency (US-EPA) as the basis for its report on Indicators of the Environmental Impact of Transportation and that emphasizes the relationship between productive activities and their effects on the environment, is the Effects-Outputs-Activities model (EPA, 1999).
• Impact indicators (outcomes). These are a measure of results; they provide quantitative information on environmental health and the effects on well-being derived from productive activities. The drawback of these indicators is the difficulty in quantifying such effects, as it is highly complex to differentiate between the effects of a given sector (in this case transportation) and those caused by other activities.
• Output Indicators. These provide information on the amount of emissions or discharges, either regular or accidental, associated with environmental damage or with the amount of resources consumed.
• Activity Indicators. These provide information on the extent of activities identified as generating adverse environmental effects.
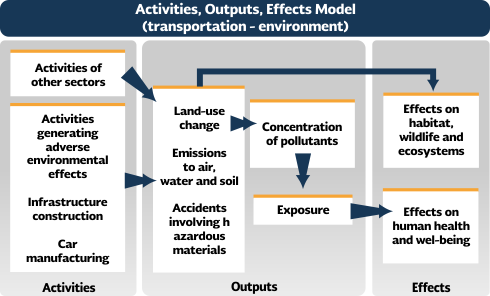
Source: EPA. Indicators of the Environmental Impacts of Transportation. 2nd Edition. Washington. 1999.
Since the 1990’s, when most of the methodological approaches to environmental indicators were proposed, considerable efforts have been made at international, national, regional, local and sectoral levels for applying such methods and adapting them to their respective fields. Specifically, the work by the OECD and the UN Commission on Sustainable Development (CSD) has significantly influenced almost every country, although along different lines: while the OECD’s initiative focused on the development of indicators for environmental and sectoral issues, the UN-CSD addressed sustainable development (which includes social, economic, environmental and institutional aspects). Some authors (e.g. CEPAL, 2001) name the former as first generation indicators, and those for assessing sustainable development as second generation ones.
First-generation environmental indicators (for addressing specific subjects or phenomena such as air quality, agriculture and environment) are formulated within a causality framework, resulting in a comprehensive but bounded view of a given phenomenon. Meanwhile, second-generation indicators are selected by identifying key variables in the four dimensions of sustainable development. Given the large number of variables and stakeholders involved in this approach, it is difficult to establish causality links, so these indicators function more like thermometers of each of the basic aspects of sustainable development. However, some efforts have recently emerged to frame these indicators within a causality scheme, albeit in general terms (IFEU, 2003).
Another way to categorize sets of indicators is the one suggested by Bakkes et al. (1994), who propose three different but complementary ways: i) by use: early-warning, policy or scientific development indicators, ii) by object: according to the object described, such as the classification according to environmental issues: air, water or productive sectors, and iii) by position in the causality chain, as the one used by OECD.
Another classification proposal is outlined in the document entitled Expanding the Measure of Wealth, Indicators of Environmentally Sustainable Development (World Bank, 1997), which classifies indicator initiatives according to the degree to which they summarize the information and reflect the degree of progress in the integration and maturation of the indicators sets. Categories of concentration effort are:
• Atomized or individual indicators.
• Thematic indicators.
• Systemic indicators.
A brief description of each follows.
2.3.1. Atomized or individual indicators
These sets represent the lowest level of aggregation and are characterized by a long list or menu of indicators, which can easily reach over one hundred of them. The philosophy behind these sets is to identify key variables on a number of subjects of interest, the monitoring of which would reveal the progress made in achieving certain objectives, but without considering causality aspects. Indicator sets are usually extensive since these initiatives have emerged in a multinational context encompassing countries with different characteristics.
The identification of indicators included in these sets is usually done by bringing together regional experts and institutions, who propose indicators in their respective area of specialty. These recommendations are compiled by a task force that generates a proposal, which is subsequently refined as it is applied in different regions. The typical example is the initiative of the UN Commission on Sustainable Development (CSD), which began in 1995 and provides a conceptual framework and a host of indicators (UNCDS, 1996).
In Latin America there are two interesting efforts. One is coordinated by the UN-ECLAC and the other emerged in the context of the Latin American and Caribbean Initiative for Sustainable Development (ILAC). UN-ECLAC is conducting the Assessment of Sustainability in Latin America and the Caribbean project (ESALC, for its acronym in Spanish), which supports the definition of public policies through an assessment of the causal links between ecological, economic, social and institutional subsystems based on the combined use of indicators. The choice of indicators in this system gathers international experiences, specifically those of the UN-CSD and of each country in the region. It includes indicators of the conditions and interlinkages of ecological subsystems (economic, environmental, social and institutional) as established in the methodological framework, as well as indicators to assess the intensity or efficiency of economic and demographic dynamics intrinsic to the socio-ecological system.
In the case of the ILAC, the draft proposal was prepared during the Experts Meeting on Environmental Indicators and Statistics of the Forum of Environment Ministers of Latin America and the Caribbean, held in Costa Rica in 2003. The selection process of indicators especially referred to the goals of the UN Millennium Development Goals. ILAC was chartered as a political and ethical response to the need to give practical meaning to processes being carried out in preparation for the World Summit on Sustainable Development. One of the ILAC’s goals is to develop and implement an assessment process to track the progress towards meeting the development goals, especially to the results of the Johannesburg Plan of Implementation, through the adoption of national and regional sustainability indicators in line with the region’s social, economic and political characteristics (PNUMA, Banco Mundial, 2004). Targets and subjects included in this initiative address: biodiversity, water management, vulnerability and sustainable cities, social issues (health, inequality and poverty), economic issues (competitiveness, trade and production and consumption patterns), and institutional issues.
2.3.2. Thematic indicators
As for environmental indicator, many countries adopt an intermediate aggregation approach, defining usually small sets of indicators for each of the major environmental policy subjects.
One of the institutions that has adopted this approach is the United States Agency for International Development (USAID), which has compiled a set of indicators for each of their programs to assess environmental performance. This approach has also been used by other countries including Canada, The Netherlands, Germany, Finland, Iceland, Norway and Sweden, which, while still keeping a set of indicators organized according to the PSR model, also group them into a number of environmental policy subjects (World Bank, 1997).
The OECD’s work on environmental indicators has also followed this approach, enriched by practical experience in using analytical and assessment tools. For example, the OECD’s environmental performance reviews systematically use indicators to support and illustrate the analyses. In this way, feedback is obtained on the political relevance and analytical soundness of environmental indicators (OECD, 1996).
2.3.3. Systemic indicators
This type of indicator sets has been designed to show, through unique values, when complex systems are affected. These indicators are more ambitious in terms of summarizing information, and often lose accuracy due to their higher aggregation.
An example of this type of indicators sets is the one developed by the World Bank and known as The Wealth and Genuine Saving Indicators, which include a balance between the increase in physical and human capital produced (the latter calculated from investments in education and healthcare services) and the reduction of natural capital (loss of resources and pollution-driven deterioration), all in relation to the gross domestic product. According to this indicator, a downward trend means that the country's development is not sustainable (World Bank, 1997).
According to this way of classifying indicators, indices are only a particular case of systemic indicators that summarize the state of development in unique values. These are based on the temporal, spatial or thematic aggregation of indicators and parameters through specific algorithms, with the purpose of displaying information in a more synthesized manner.
This combination of the information contained in two or more indicators, known as aggregate indices, tries to convey simple messages about complex environmental issues. Their advantages include the potential to simplify public communication processes and reach audiences that typically receive little environmental information. One must bear in mind, however, that reducing the number of indicators by aggregating information involves the risk of misinterpretation by users, who are not always aware of the scope and limitations of index methodologies. On the other hand, the message it intends to convey may be distorted by the absence of some data and differences in the quality of information or concepts.
Important aspects to consider when developing and using indicators
• Good indicators cannot be developed without soundly supported information.
• Assessing performance requires clear objectives.
• Different people in different places have different values and aspirations. Indicators should be capable of reflecting and collecting the interests of a diversity of places, people, cultures and institutions.
• Indicators sets should evolve over time to remain useful; hence, these should be under continuous review.
• Indicator sets are rarely complete and are always perfectible.
• Knowledge obtained from indicators can be used for reducing the uncertainty of what we know about the system, but does not eliminate it. The vision derived from indicators is always a simplified and imperfect version of reality.
|
Finally, it is worth remembering that the formulation of environmental indicators, in addition to other assessment tools, is an ongoing process that evolves according to the needs of each initiative. It is easy to foresee that their scope and importance is ever-increasing in a more participatory society that requires and demands objective and reliable information to build their viewpoints and make their own decisions.
In addition to their intrinsic utility, efforts focused on developing indicators have been key to guide and foster the integration and systematization of environmental information. The development of indicators has demanded a major effort in data gathering and analysis which, in turn, have forced the definition of strategies for database gathering and integration, and the use of quality assessment processes.

|