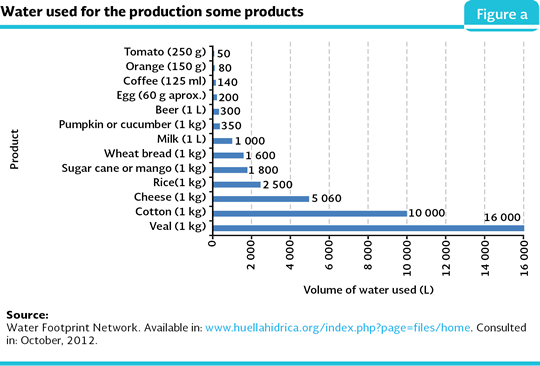
The water footprint is defined as the total volume that is used to produce the goods and services consumed by the inhabitants of a country (Chapagain and Hoekstra, 2004). This concept was introduced to provide information about how the water is used in the production and to complement the traditional indicators of the liquid use done by the different sectors. As an added indicator shows the water total requirements of a country, and it is a measure of the human consumption impact on the water resources. The water footprint concept is closely related to the virtual water concept which is the amount of water used during the production process of a good or a service (Figure a).
According to Mekonnen and Hoekstra (2011), the water footprint has three components: blue, green and gray. The blue footprint refers to the consumption of surface and groundwater resources which evaporate or are added to a product. The green one corresponds to the consumed rain water volume, which is particularly relevant in the production of seasonal crops. Finally, the gray footprint is the necessary volume of freshwater to assimilate the load of pollutants discharged in the domestic waters and in the wastewater that are the result of the industrial and agricultural activities.
At a global level, in the period 1997-2001, 86% of the water footprint was related to the consumption of agricultural products, 10% to the consumption of industrial goods and about 4% to the household uses (Chapagain and Hoekstra, 2004). Between 1996 y 2005, the countries with the highest water footprint at a world level were China (1,207 Gm3/year1), India (1,182) and the United Kingdom (1,053), that as a whole, was about 38% of the world water footprint (Mekonnen and Hoekstra, 2011).
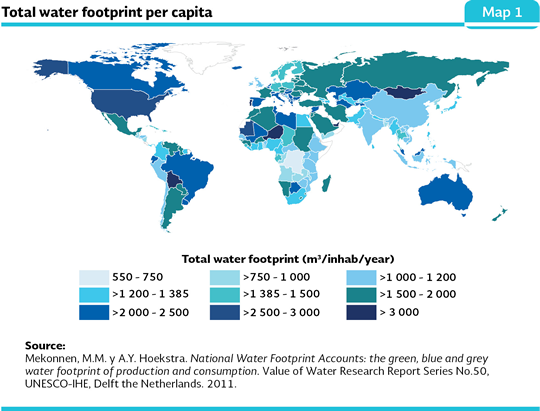
The water footprint per capita is the total volume of water used to produce the goods and services that a person consumes. It is obtained multiplying all of the goods and services consumed by an average inhabitant times its own virtual water content. The principal factors that determine the water footprint per capita are: 1) the average water consumption per person; 2) the consumption habits of its inhabitants; 3) the climate, particularly, the evaporation, that determines the farming conditions; and 4) the efficiency of water use in the agricultural and industrial production.
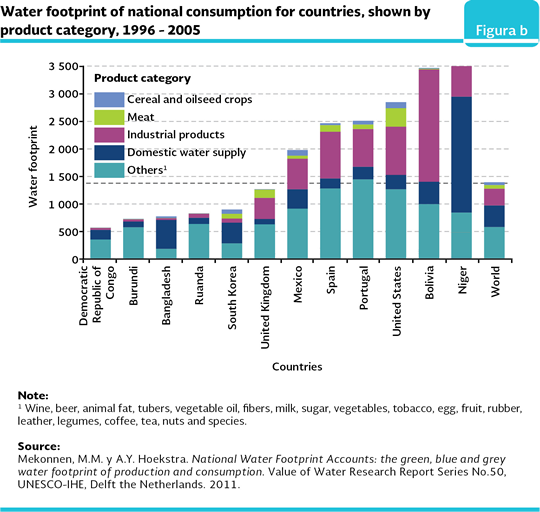
In the developed countries, where the level of consumption of goods and services is high, the water footprint per capita is high, at some extent it is due to the high meat consumption as well as industrialized products. Between 1996 and 2005, the industrialized countries reached a water footprint per capita between 1,250 and 2,850 m3/year; with the United Kingdom in the inferior extreme of the interval and the United States in the superior extreme. On the other hand, the developing countries even when they may have meat consumption relatively lower than the industrialized countries, may record high water footprints per capita as a result of a low efficiency in the water use and the unfavorable farming conditions. As a prove of that, the countries which reached the highest water footprint per capita, in the same period, were Mongolia (3,775 m3/year), Niger (3,519) and Bolivia (3,468; Figure b and Map 1). In the case of Mexico, its water footprint per capita recorded in the same period was 1,978 m3/year per inhabitant; what makes it 42% higher than the world average.
If the water footprint per sector is analyzed, between 1996-2005, the annual average global footprint related to the agriculture, the industrial production and the water supply for household consumption was 9,087 Gm3/year (74% was for the green footprint, 11% to the blue one and 15% to the gray one). From this global value, 92% corresponded to the agriculture production, 4.4% to the industrial production and 3.6% to the household use.
The fact that many products consumed in a country may be produced in another country means that the actual water demand of a country, frequently, is different from what the national extractions suggest. The countries with a great economic development may use, by means of the product imports, water resources from other countries, so they reduce the pressure over their own water resources. The water footprint of a country has, therefore, internal and external components. The internal water footprint is the used volume of water resources of the country, while the external one corresponds to the water volume used in other countries to produce the imported and consumed goods and services.
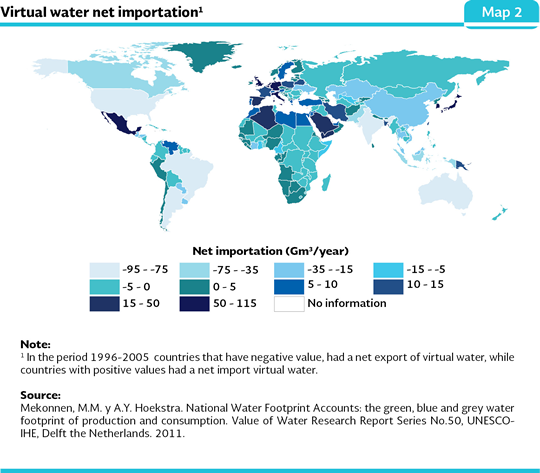
The world biggest countries, exporters of virtual water, are in North and South America: the United States, Canada, Brazil and Argentina; in the south of Asia: India, Pakistan, Indonesia and Thailand; and Australia. In the other extreme, the largest virtual network of water importers is made up of the countries of North Africa and the Middle East, Mexico, Europe, Japan and South Korea (Map 2). Mexico is placed in the sixth world place of the country importers of virtual water, with a net import of 92 Gm3/year, which reduces its water demand compared to what it would be needed if it had to produce the total amount of products (mainly agricultural) to meet the demand of the Mexican population (Chapagain et al., 2006).
The products with a large participation in the global virtual water flows are the cereals (17% of the total flow of international virtual water), industrial products (12.2%), coffee, tea and cocoa (7.9%), as well as the meat products (6.7%). Notwithstanding, the largest flow of international virtual water is the one assigned to the oil seeds (such as cotton, soy beans, palm oil, sunflower and rapeseed oil) and derived products, whose participation represents almost 44% of the total amount of international virtual water flows.
Note:
1 1 Gm3 = 1 cubic gigameter = a thousand million of cubic meters.
REFERENCES:
Chapagain, A.K. y A. Y. Hoekstra. Water footprints of nations, value of water. Research Report Series 16, UNESCO-IHE. Delf. Netherlands. 2004. Disponible en: www.waterfootprint.org Fecha de consulta: octubre de 2012.
Chapagain, A.K., A. Y. Hoekstra y H.H.G. Savenije. Water saving through international trade of agricultural products. Hydrology and Earth System Sciences 10: 455-468. 2006.
Mekonnen, M.M. y A.Y. Hoekstra. National Water Footprint Accounts: the green, blue and grey water footprint of production and consumption. Value of Water Research Report Series No.50. UNESCO-IHE, Delft the Netherlands. 2011.
|